Original Link: https://www.anandtech.com/show/20056/ecs-liva-q3d-and-acemagic-t8-plus-micropcs-review-jasper-lake-and-alder-laken-in-a-smallerthanucff-package
ECS LIVA Q3D and ACEMAGIC T8 Plus micro-PCs Review: Jasper Lake and Alder Lake-N in a Smaller-than-UCFF Package
by Ganesh T S on September 21, 2023 9:10 AM EST- Posted in
- Systems
- Intel
- ECS
- LIVA
- Jasper Lake
- Alder Lake-N
- AceMagician
- micro-PC
Compact computing systems have gained significant market share over the last decade. Improvements in the performance per watt metric of processors have enabled the replacement of bulky desktop PCs by ultra-compact form-factor (UCFF) machines with a 4 in. x 4 in. footprint. Motivated by IoT applications at the edge, some companies such as Shuttle started creating x86 systems in sub-4x4 form-factors using Intel's Apollo Lake processors. ECS was one of the first mainstream vendors to pay attention to this segment with their LIVA Q Series using Intel's Atom series and AMD's first-generation Ryzen Embedded SoCs. With the introduction of more power-efficient platforms, Asian manufacturers such as ACEMAGIC, GMKtec, and MinisForum have also entered this micro-PC market with a wider range of processor choices.
Since the introduction of Silverthorne Atom processors in 2008, Intel has been maintaining separate microarchitectures in different product families to span a wider performance / power efficiency range. As a result, consumers could either opt for a low-power low-cost platform sacrificing on performance with Atom-class CPUs or go for a more performant Core-class CPU, albeit at a higher cost with some sacrifice on the power efficiency front. From 2008 to 2020, these remained distinct product families. However, the introduction of hybrid CPUs (starting with the short-lived Lakefield) saw cores based on both microarchitectures to be placed on the same die. The Tremont microarchitecture (developed as part of the Atom-family) made its debut in Lakefield before gaining wider market presence through Jasper Lake, Elkhart Lake, and other product families. Its successor (Gracemont) is adopting a similar trajectory. After its introduction in Alder Lake, it underwent further refinement in Raptor Lake.
Intel introduced the Alder Lake-N (ADL-N) product family to take over Jasper Lake's role in the cost-conscious low-power PC market. It is essentially an Alder Lake processor with all the performance cores removed, and a pared-down integrated GPU. As ADL-N ramps up and Jasper Lake winds down, we are seeing products based on both families being actively sold in the market. We took advantage of this opportunity to source two micro-PCs - the ECS LIVA Q3D, and the ACEMAGIC T8 Plus - and put them through our evaluation routine to study the benefits of ADL-N's Gracemont microarchitecture over Jasper Lake's Tremont. This review presents a detailed analysis of the results along with a discussion of the tradeoffs involved in pursuing a smaller-than-UCFF footprint.
Introduction and Product Impressions
Advancements in processor power efficiency and performance have resulted in sub-15W TDP SoCs becoming powerful enough to replace bulky desktops for many use-cases. Intel's NUC lineup kickstarted this trend in the early 2010s, with the 4 in. x 4 in. ultra-compact form-factor (UCFF) becoming the de-facto standard for such systems. This size was arrived at keeping the I/O requirements, disk drive sizes, and ease of board design / assembly in mind. Since that time, both storage and memory technologies have evolved significantly. Most systems use M.2 SSDs nowadays, a marked shift from the 2.5" drives common in those days. While SODIMMs continue to be the choice for systems offering memory upgrade capabilities, modern processors have started to integrate LPDDR4 / LPDDR5 support. This has resulted in a number of systems with soldered memory on board. These factors have contributed to some vendors attempting to experiment with micro-PCs - systems having a sub-4x4 footprint.
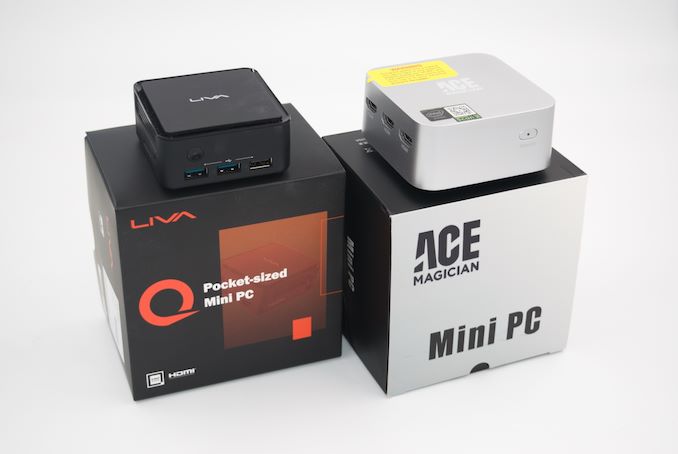
ECS LIVA Q3D
ECS has remained commited to micro-PCs since the introduction of the Apollo Lake-based LIVA Q1L. The company has followed it up with the LIVA Q2 based on the Gemini Lake refresh SoCs, the Q3 Plus based on the first-generation Ryzen Embedded SoCs, and most recently, the Jasper Lake-based LIVA Q3D. Compared to a traditional UCFF system, the LIVA Q3D series makes a couple of tradeoffs. Instead of SODIMMs, the system uses soldered LPDDR4X RAM. A M.2 SSD slot is avoided by integrating an eMMC boot drive on the board. This is complemented by a built-in microSDXC card reader. These allow the LIVA Q3D to be very compact. The 74mm x 74mm x 34.6mm (a volume of just 0.19L) system weighs just 174g.
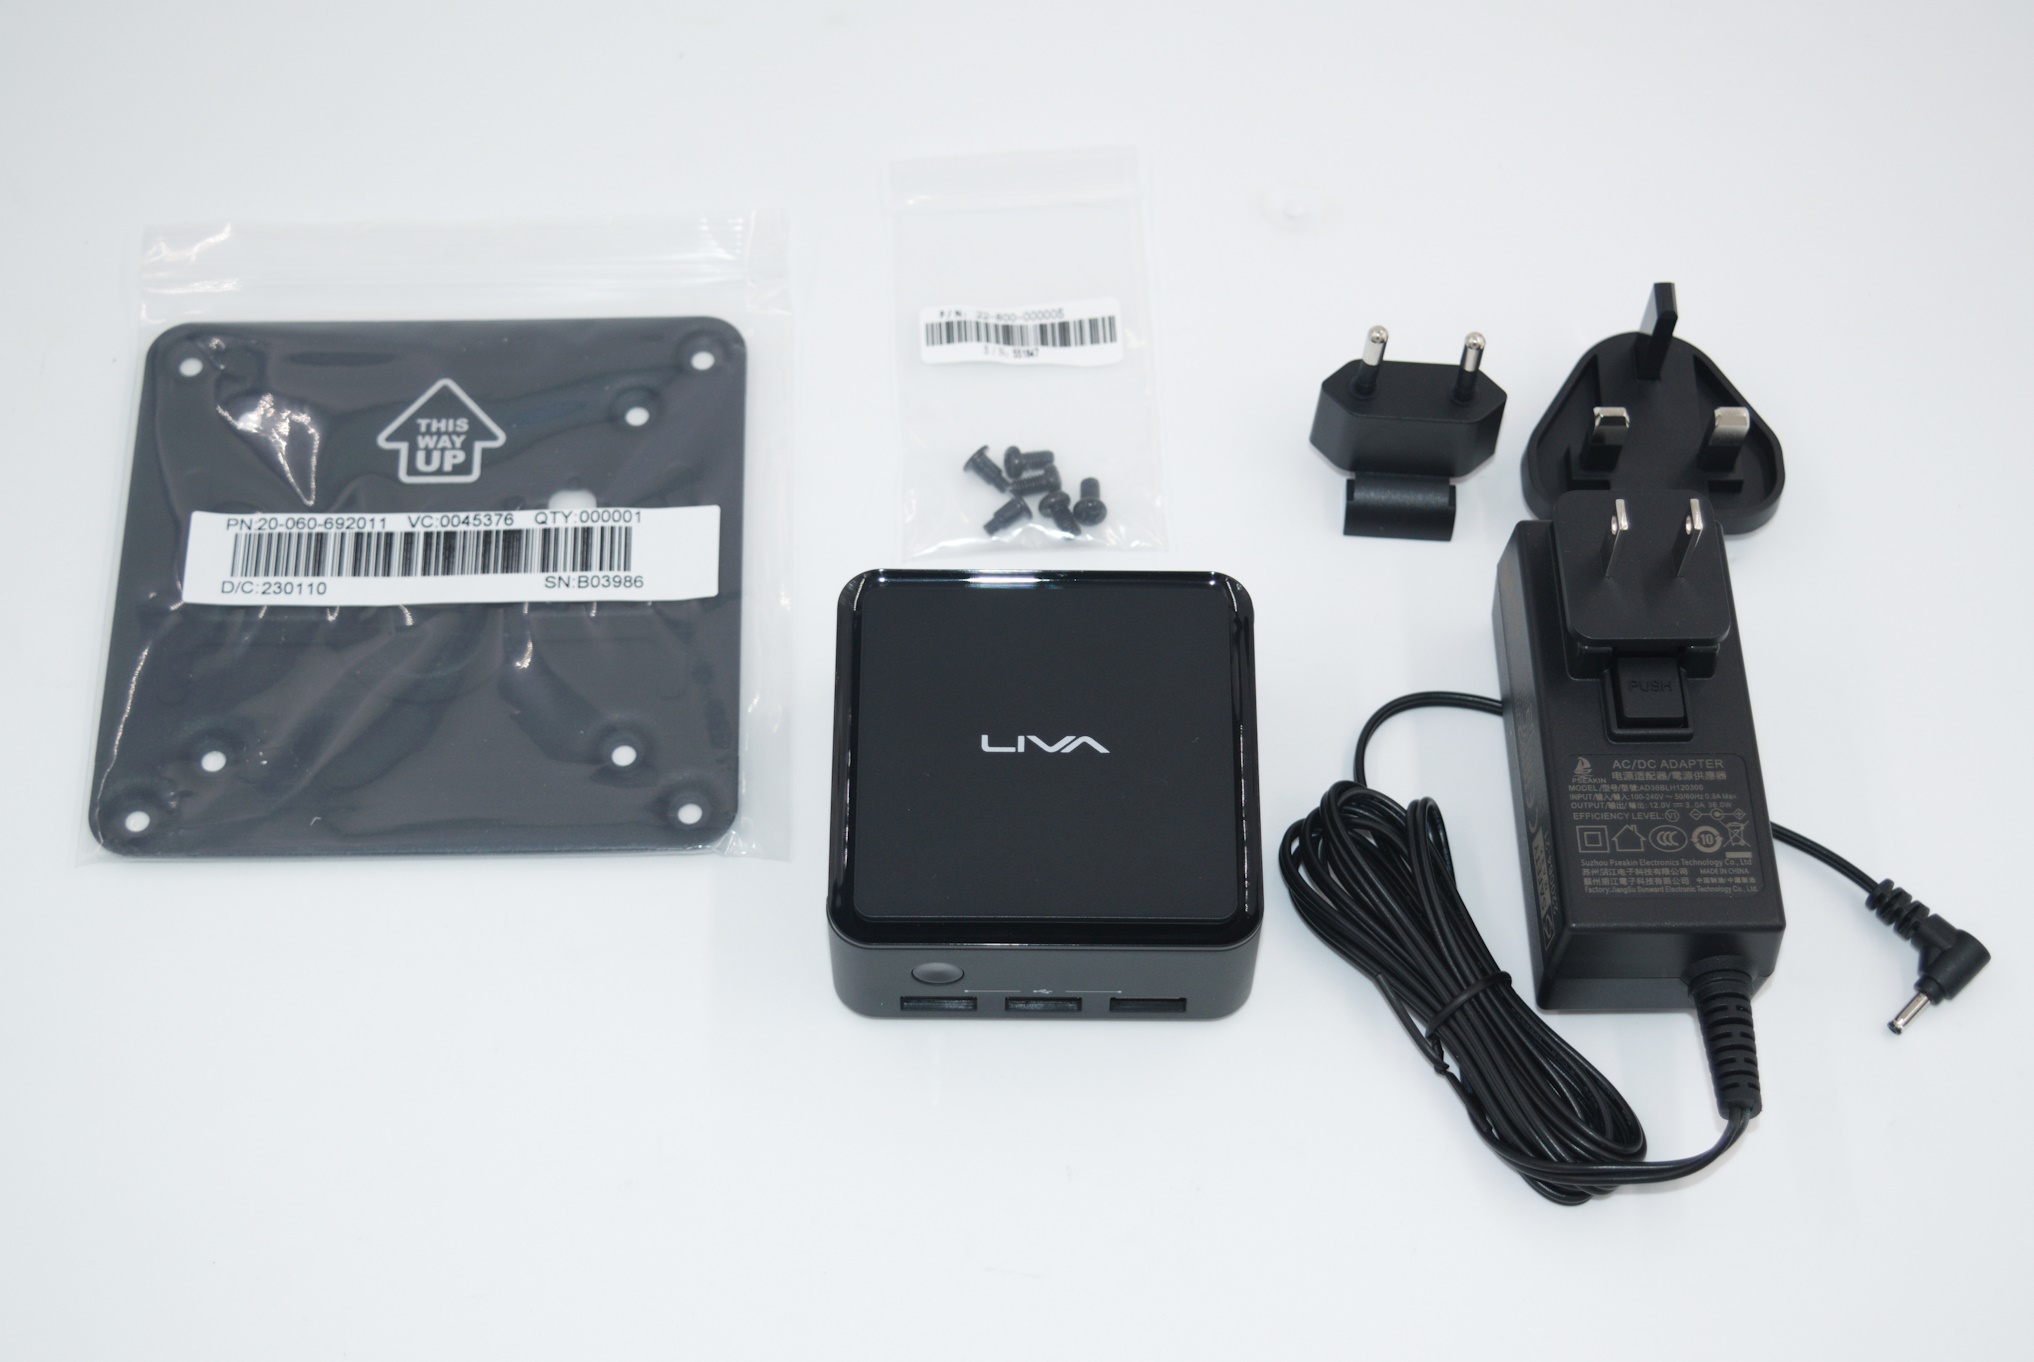
In addition to the main unit, the LIVA Q3D package comes with a VESA mount and corresponding screws, and a 36W (12V @ 3A) wall wart. The power adapter has a replaceable plug, and ECS provides US, UK, and EU adapters. The gallery below provides a comprehensive look at the chassis design and I/O ports placement. The teardown pictures provides insights into the internals of the unit.


The teardown pictures in the above gallery show that ECS has adopted a dual-board strategy for the system. While the main board has the SoC package, RAM, and eMMC, along with the audio jack, the daughterboard has all of the other I/Os including the USB and LAN ports.
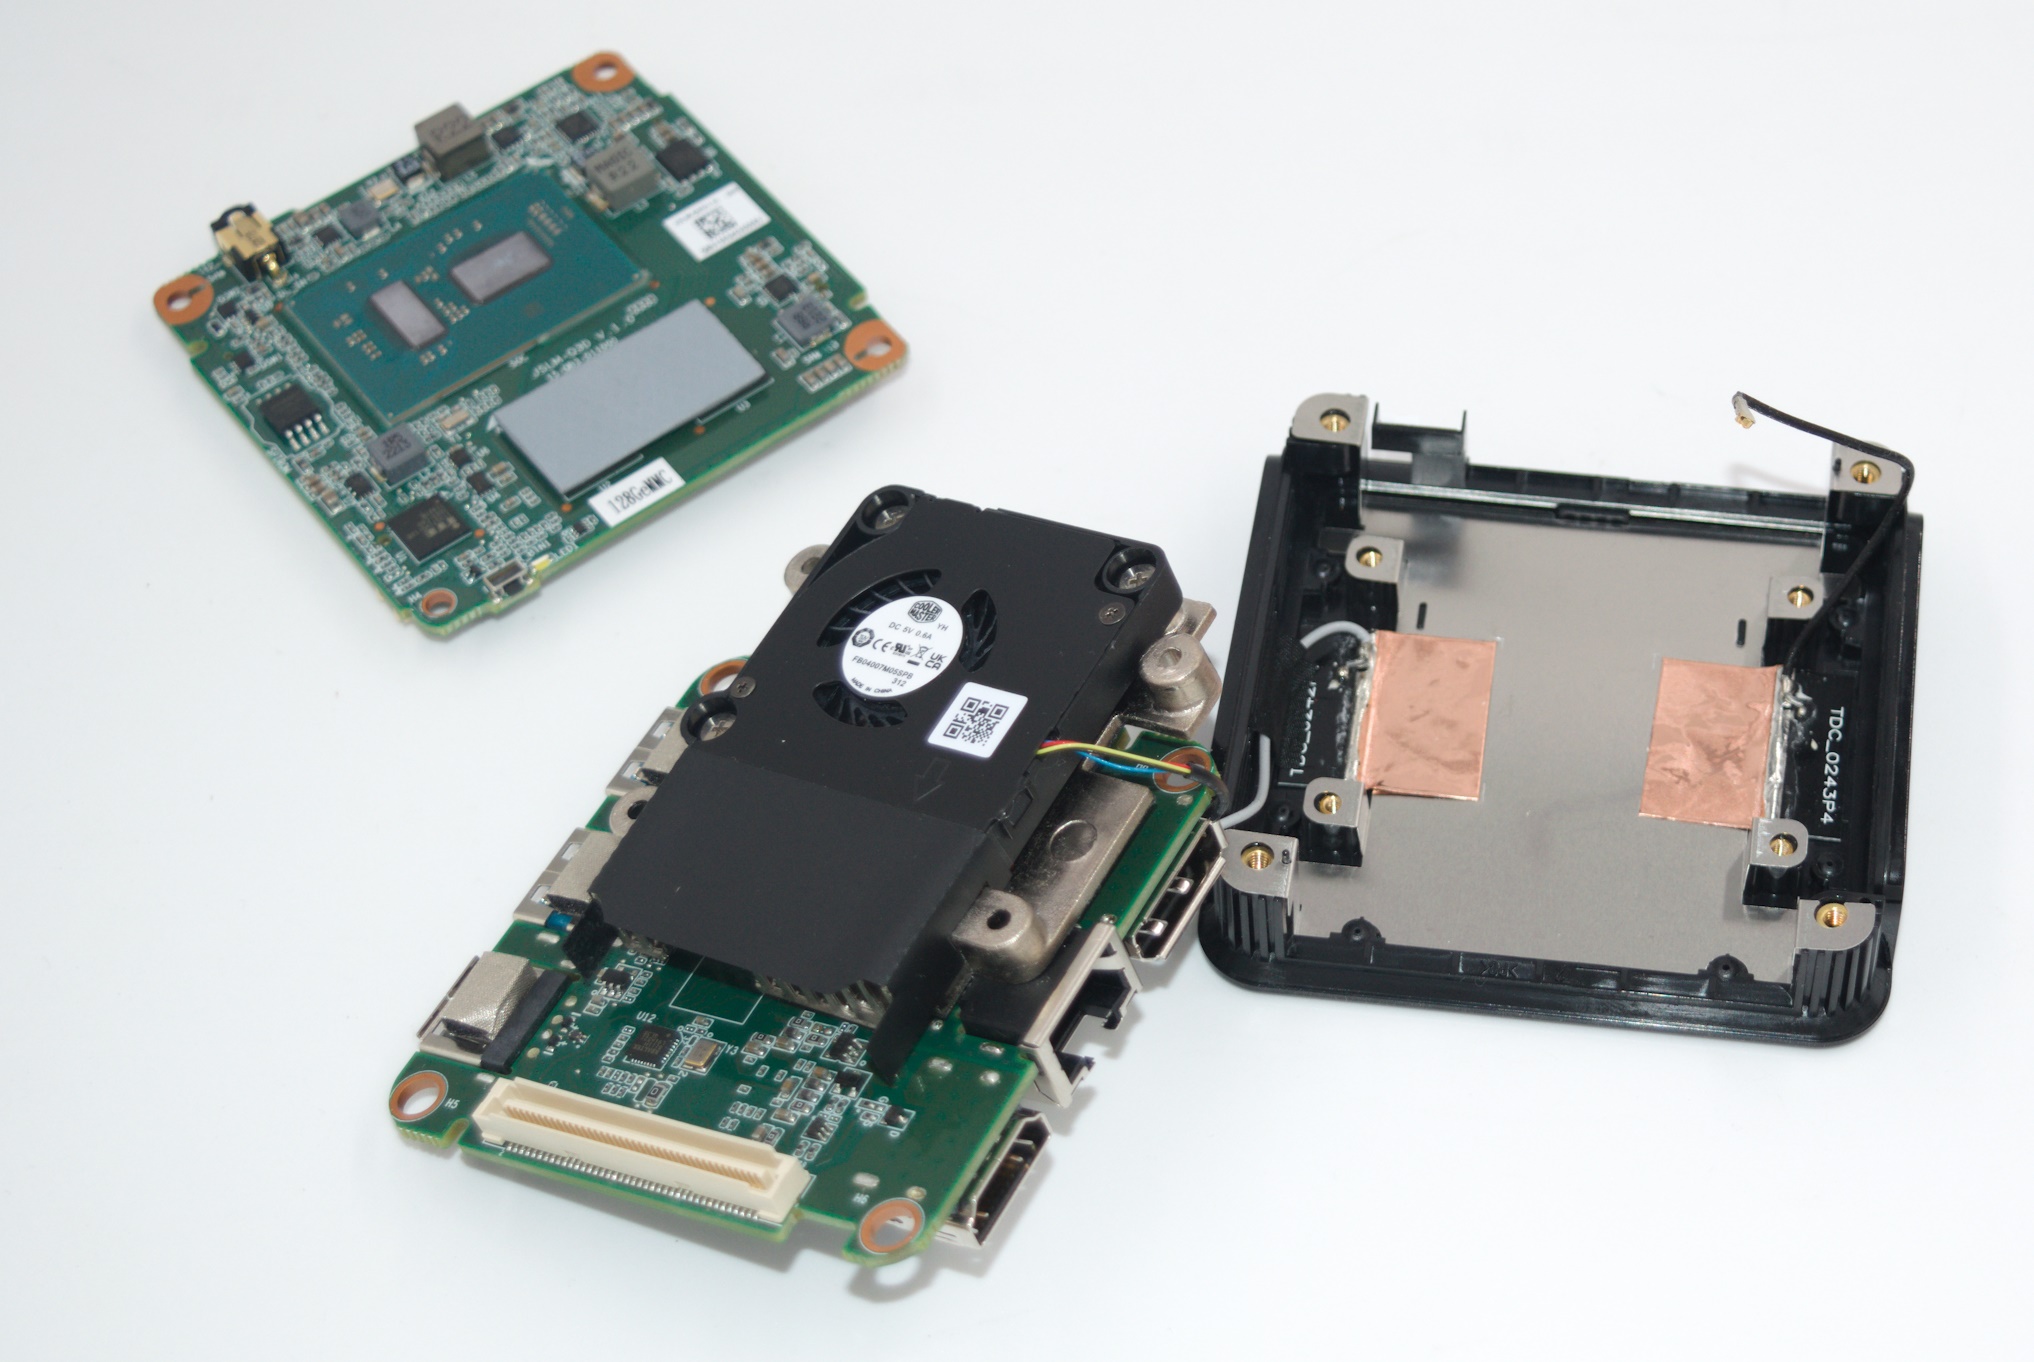
A solid heat sink is mounted with screws on top of the Jasper Lake package, and complemented by a 40mm Cooler Master blower fan to take out the heat in typical notebook style. The CMOS battery is sandwiched between the two boards and a metal shield ensures electrical interference mitigation between the components on the two boards.
ACEMAGIC T8 Plus
The T8 Plus is ACEMAGIC's first attempt at creating a micro-PC. Like the ECS LIVA Q3D, the T8 Plus also utilizes soldered RAM. However, thanks to the newer memory support in ADL-N, the board adopts LPDDR5 RAM. A semblance of upgradability is maintained, thanks to the use of a M.2 2242 SATA SSD as a boot drive. The 89.4mm x 89.4mm x 43.4mm (0.35L) system weighs 205g.
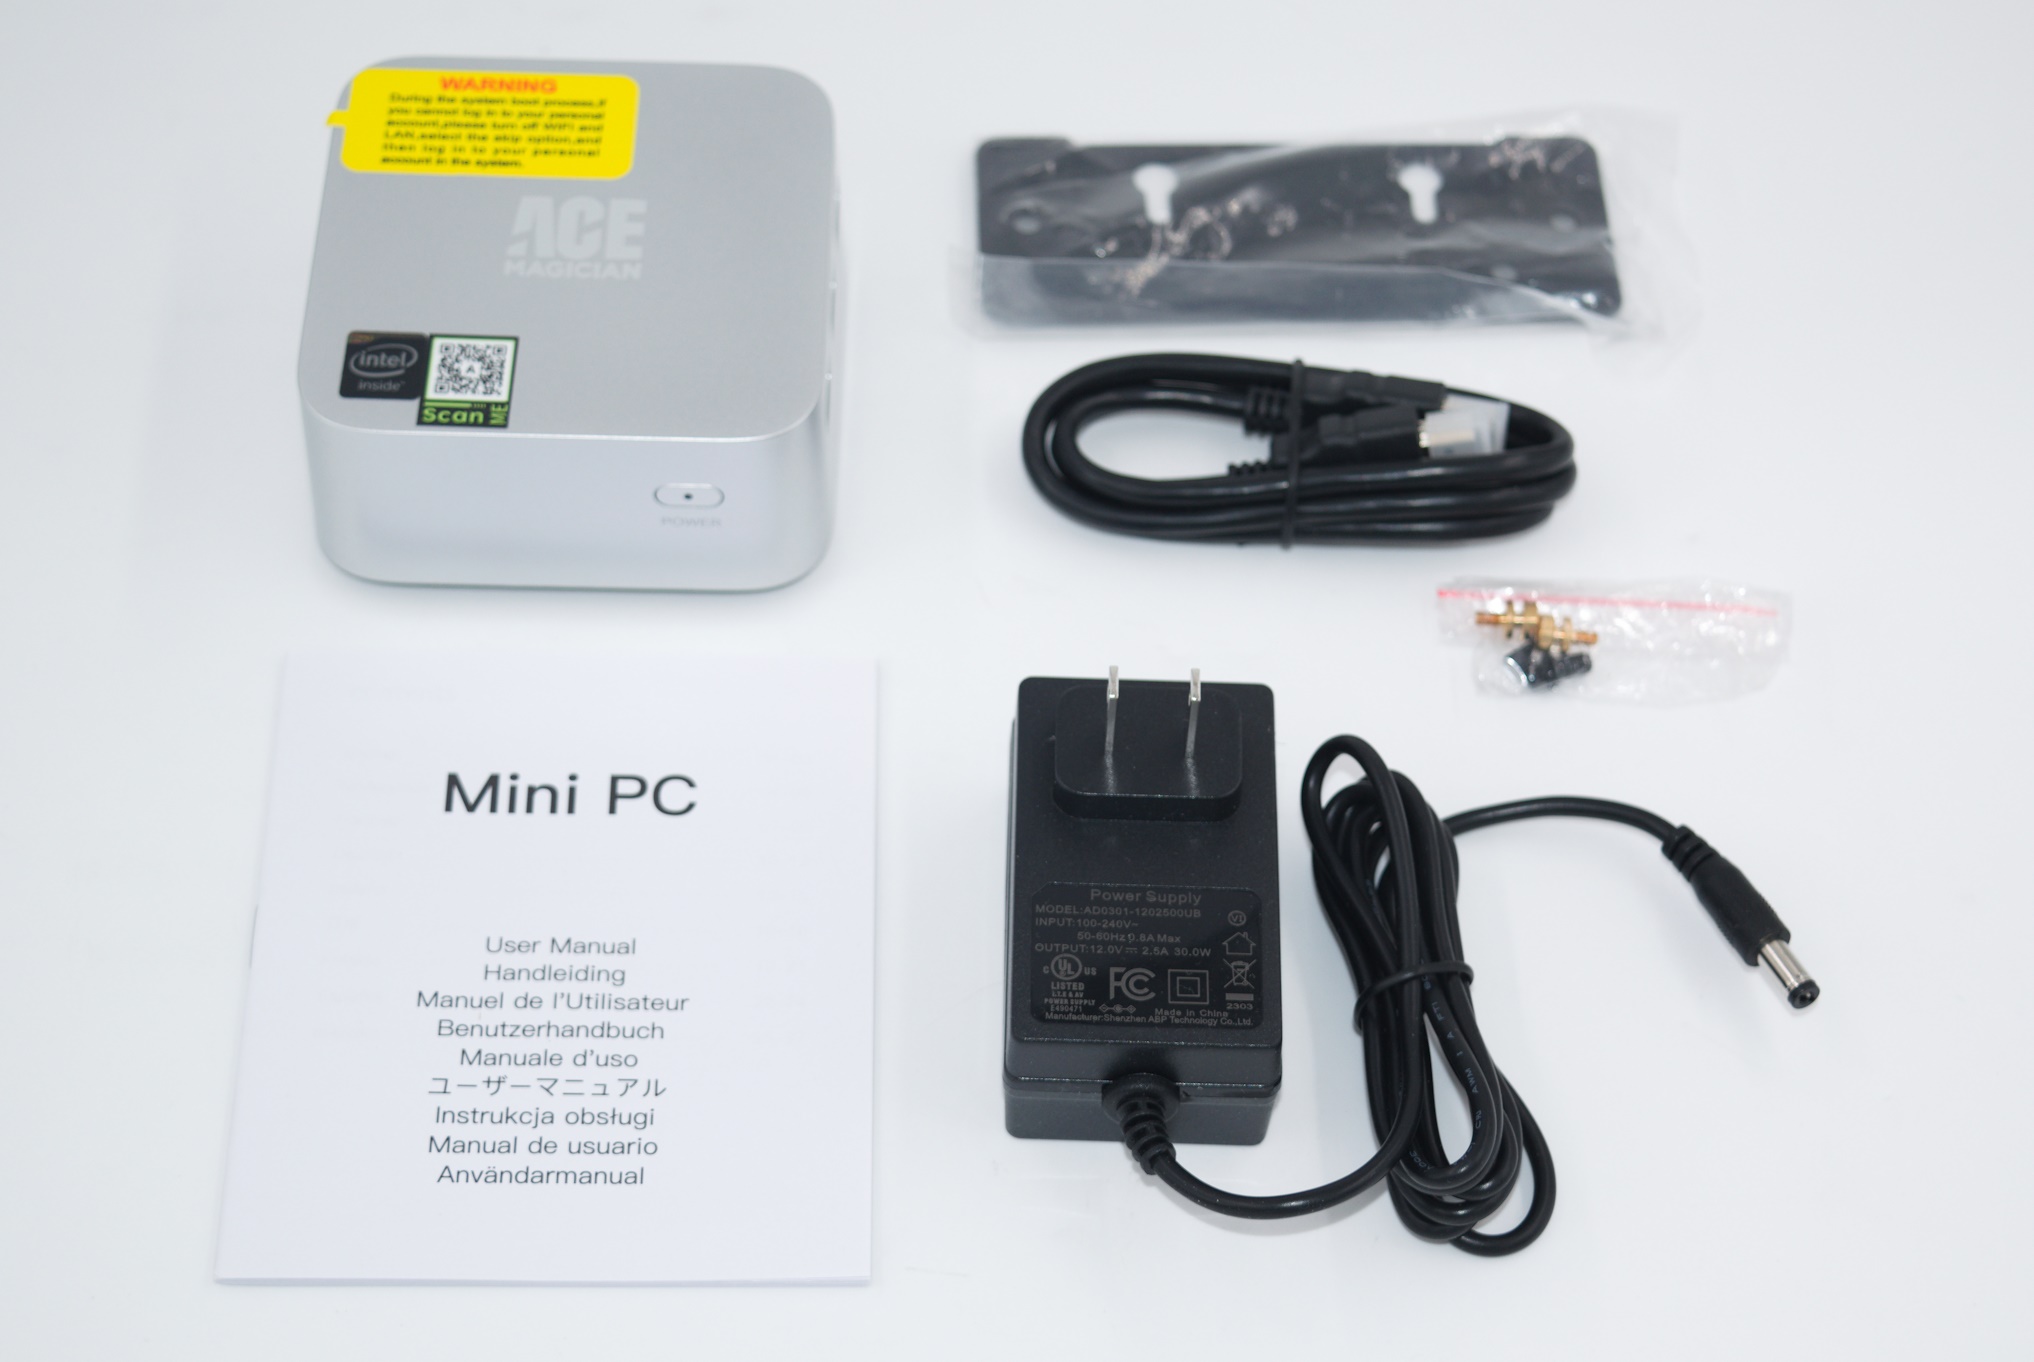
In addition to the main unit, the T8 Plus package comes with a HDMI cable, wall mount with associated screws, an user manual, and a 30W (12V @ 2.5A) geo-specific wall wart. The gallery below provides a look at the chassis design and I/O ports placement. Teardown pictures providing insights into the internals are also included.


The pictures show the presence of a raised segment on the underside. This circular segment also includes perforations that allow for cool air to be drawn in before exiting through the copper heat spreader's fins. Unlike the LIVA Q3D, the T8 Plus uses a single board design.
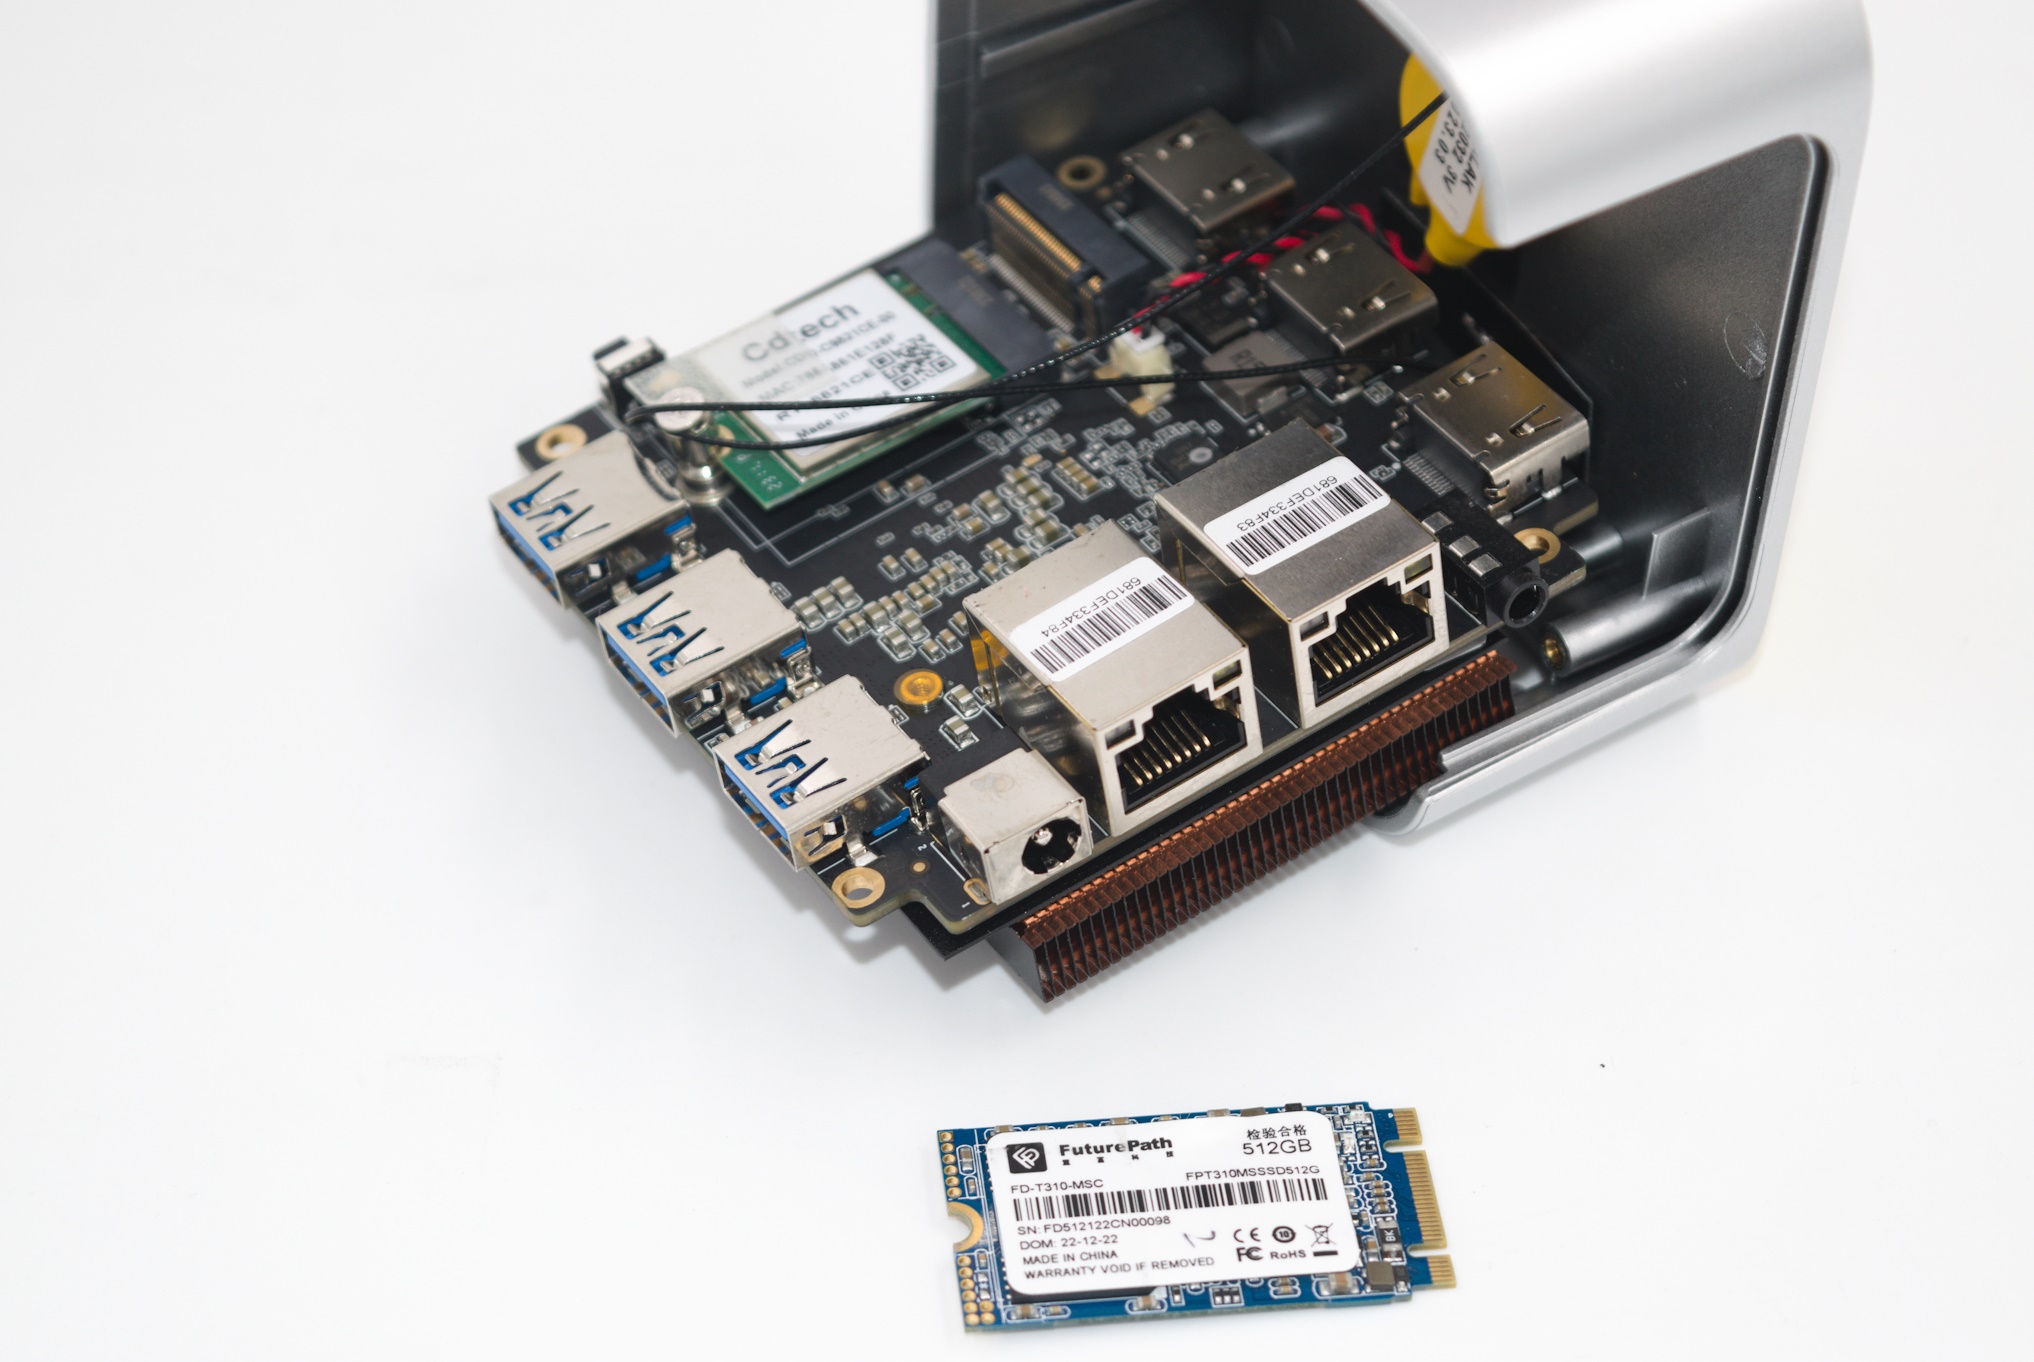
The RAM and the SoC package are under the heat sink / fans, while the M.2 2230 slot for the WLAN / BT card, and the M.2 2242 SATA SSD slot are on the other side (closer to the top panel). The pre-installed SSD is from FuturePath, but we were unable to make out the name of the controller manufacturer despite the availability of the logo in the final picture of the above gallery. The CMOS battery and the WLAN antennae are affixed to the underside of the chassis top panel.
Both systems came ready with Windows OS pre-installed. The full specifications of the two review samples (as tested) are summarized in the table below.
| Systems Specifications (as tested) |
||
| ACEMAGIC T8 Plus | ECS LIVA Q3D | |
| Processor | Intel Processor N95 Alder Lake-N 4C/4T, 1.7 - 3.4 GHz Intel 7, 6MB L3, 15W (PL1 = 15W / PL2 = 15W) |
Intel Pentium Silver N6000 Jasper Lake 4C/4T, 1.1 - 3.3 GHz Intel 10nm, 4MB L3, 6W (PL1 = 10W / PL2 = 25W) |
| Memory | Samsung K3LKBKB0BM-MGCP LPDDR5-3200 (Single-Channel / 4 x16) 36-32-32-68 @ 3200 MHz 16 GB |
Micron MT53E1G32D2NP-046 LPDDR4X-2933 (Single-Channel / x32) 28-27-27-62 @ 2933 MHz 4 GB |
| Graphics | Intel UHD Graphics (16EU @ 1200 MHz) |
Intel UHD Graphics 605 (32EU @ 350 - 850 MHz) |
| Disk Drive(s) | Futurepath FPT310M4SSD512G (512 GB; SATA III 6 Gbps;) (?? TLC NAND; ?? Controller) |
Kingston Y29128 (128 GB; eMMC 5.1 HS400;) (3D TLC; Phison PS8229 Controller) |
| Networking | 2x GbE RJ-45 (Realtek RTL8168/8111) Realtek RTL8821CE Wi-Fi 5 / Bluetooth 4.2 (1x1 802.11ac - 433 Mbps) |
1x GbE RJ-45 (Realtek RTL8168/8111) Realtek RTL8822CE Wi-Fi 5 (2x2 802.11ac - 867 Mbps) |
| Audio | 3.5mm Audio Jack Digital audio and bitstreaming support over HDMI Outputs |
Digital Audio and Bitstreaming Support over HDMI and DisplayPort Outputs |
| Video | 3x HDMI 2.1 (up to 4Kp60) | 1x HDMI 2.0a 1x DisplayPort 1.4a |
| Miscellaneous I/O Ports | 3x USB 3.2 Gen 1 (5 Gbps) Type-A | 2x USB 3.2 Gen 1 Type-A (Front) 1x USB 2.0 Type-A (Front) 1x microSDXC (Side) |
| Operating System | Windows 11 Enterprise (22000.2360) | Windows 11 Enterprise (22000.2124) |
| Pricing | (Street Pricing on Sep 18th, 2023) US $207 ($177) (with limited use / limited time coupon UQSYLW9R) |
US $285 (w/ 128 GB eMMC, 4GB LPDDR4X, and OS) |
| Full Specifications | ACEMAGIC T8 Plus Specifications | ECS LIVA Q3D Specifications |
In the next section, we take a look at the system setup and follow it up with a detailed platform analysis.
Setup Notes and Platform Analysis
Our review samples of the ECS LIVA Q3D and the ACEMAGIC T8 Plus came with all necessary components pre-installed - including the OS. Prior to setting up the OS on first boot, we took some time to look into the BIOS interface of both systems.
The BIOS interface of the T8 Plus is fairly basic (navigable only via keyboard), but a large number of options are exposed for end users to play with. The video below presents the entire gamut of available options.
The startup screen shows the specifications of the system such as processor model, memory capacity and speed, along with date and time settings. The 'Advanced' section provides information about the CPU cores and also has a wide range of options controlling the availability of features such as virtualization support to the OS. This section also includes control over CPU power management features such as SpeedStep, SpeedShift, Race-to-halt, C-states etc, as well as GPU power management features. Under the CPU subsection, various knobs relevant to turbo modes are also available. The PL1 and PL2 values can also be configured - with the default values being 15W for both. Fine-grained control over the CPU voltage regulators can also be exercised in this section. Information relevant to the network ports (such as UEFI driver version) is also reported.
The 'Chipset > System Agent Configuration' page allows setting of the maximum memory speed. The 'Security' section allows the BIOS to be protected with a password and also the configuration of secure boot (enabled by default). The 'Boot' section allows configuration of boot order and features such as fast boot, etc. The 'Save & Exit' section allows restoration of default or previously saved settings, and also a one-time boot override.
On the other hand, the BIOS interface of the ECS LIVA Q3D is essentially informational in nature.
The only configurable parameters appear to be the system language, date, and time.
Given the target market for Jasper Lake and Alder Lake-N, the number of PCIe lanes for adding extra functionality is limited. Even though the SoCs do include USB 3.2 Gen 2 (10 Gbps) support, many vendors often limit the USB ports to Gen 1 speeds (5 Gbps). The case with both the ECS LIVA Q3D and the ACEMAGIC T8 Plus is similar - all USB ports are only capable of the 5 Gbps speeds.
The diagram below brings out the high-speed I/O distribution for the ACEMAGIC T8 Plus.
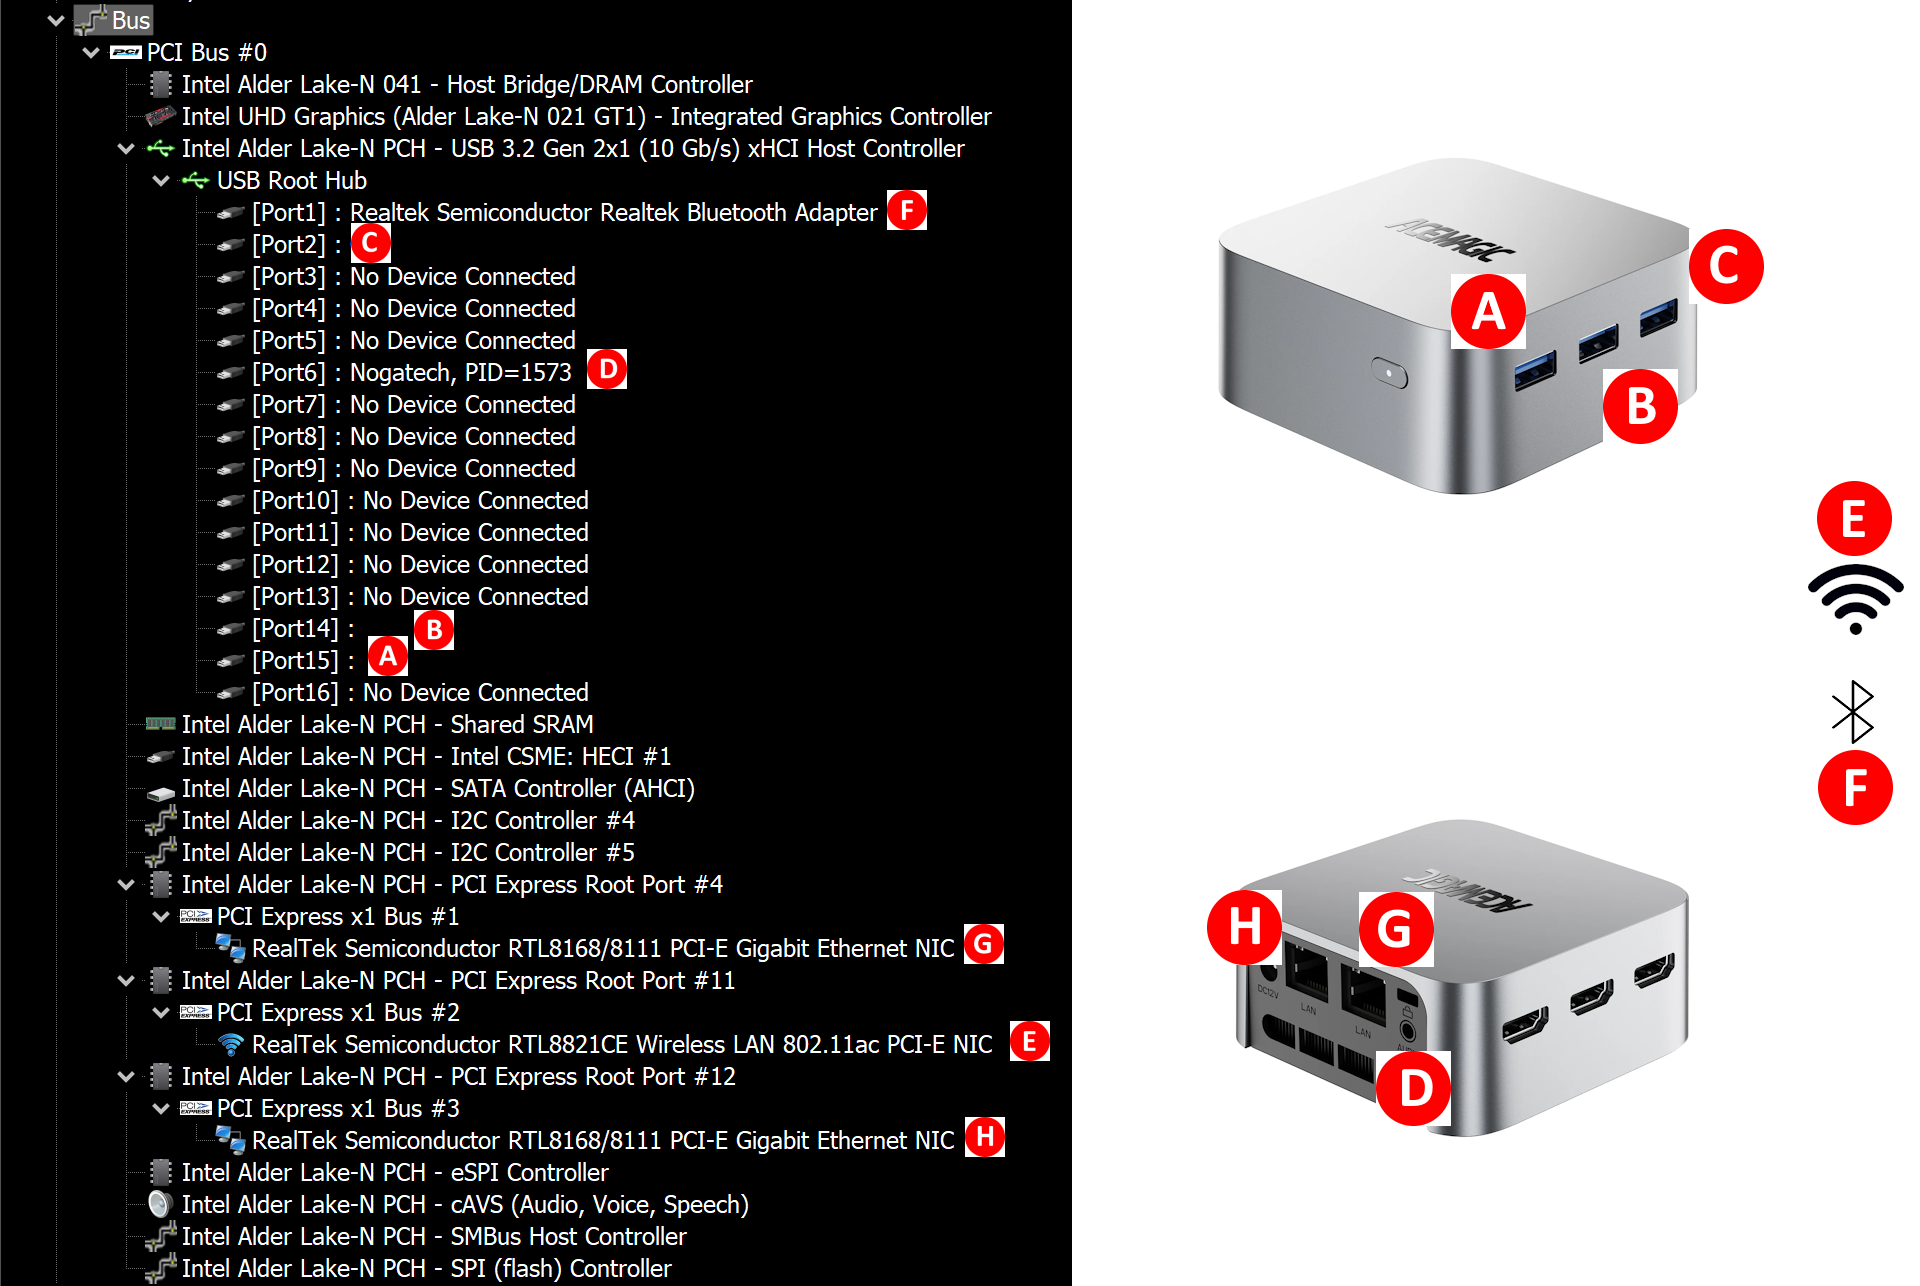
Other than the USB ports, the high-speed I/O lanes are distributed as below:
- PCIe 3.0 x1 #1: Realtek RTL8168/8111 Gigabit Ethernet NIC
- PCIe 3.0 x1 #2: Realtek RTL8821CE WLAN 802.11ac PCIe NIC
- PCIe 3.0 x1 #3: Realtek RTL8168/8111 Gigabit Ethernet NIC
One of the interesting things to note here is that the audio jack is enabled by a USB audio chip from Zoran / Nogatech.
The corresponding analysis for the ECS LIVA Q3D is quite similar. There is no audio jack in the system (with digital audio via the HDMI / DisplayPort outputs being the only option for that purpose). One of the PCIe wired NIC controllers is replaced by an Alcor SD card reader controller. The LIVA Q3D also uses a 2x2 Wi-Fi 5 controller (compared to the T8 Plus's 1x1 version).
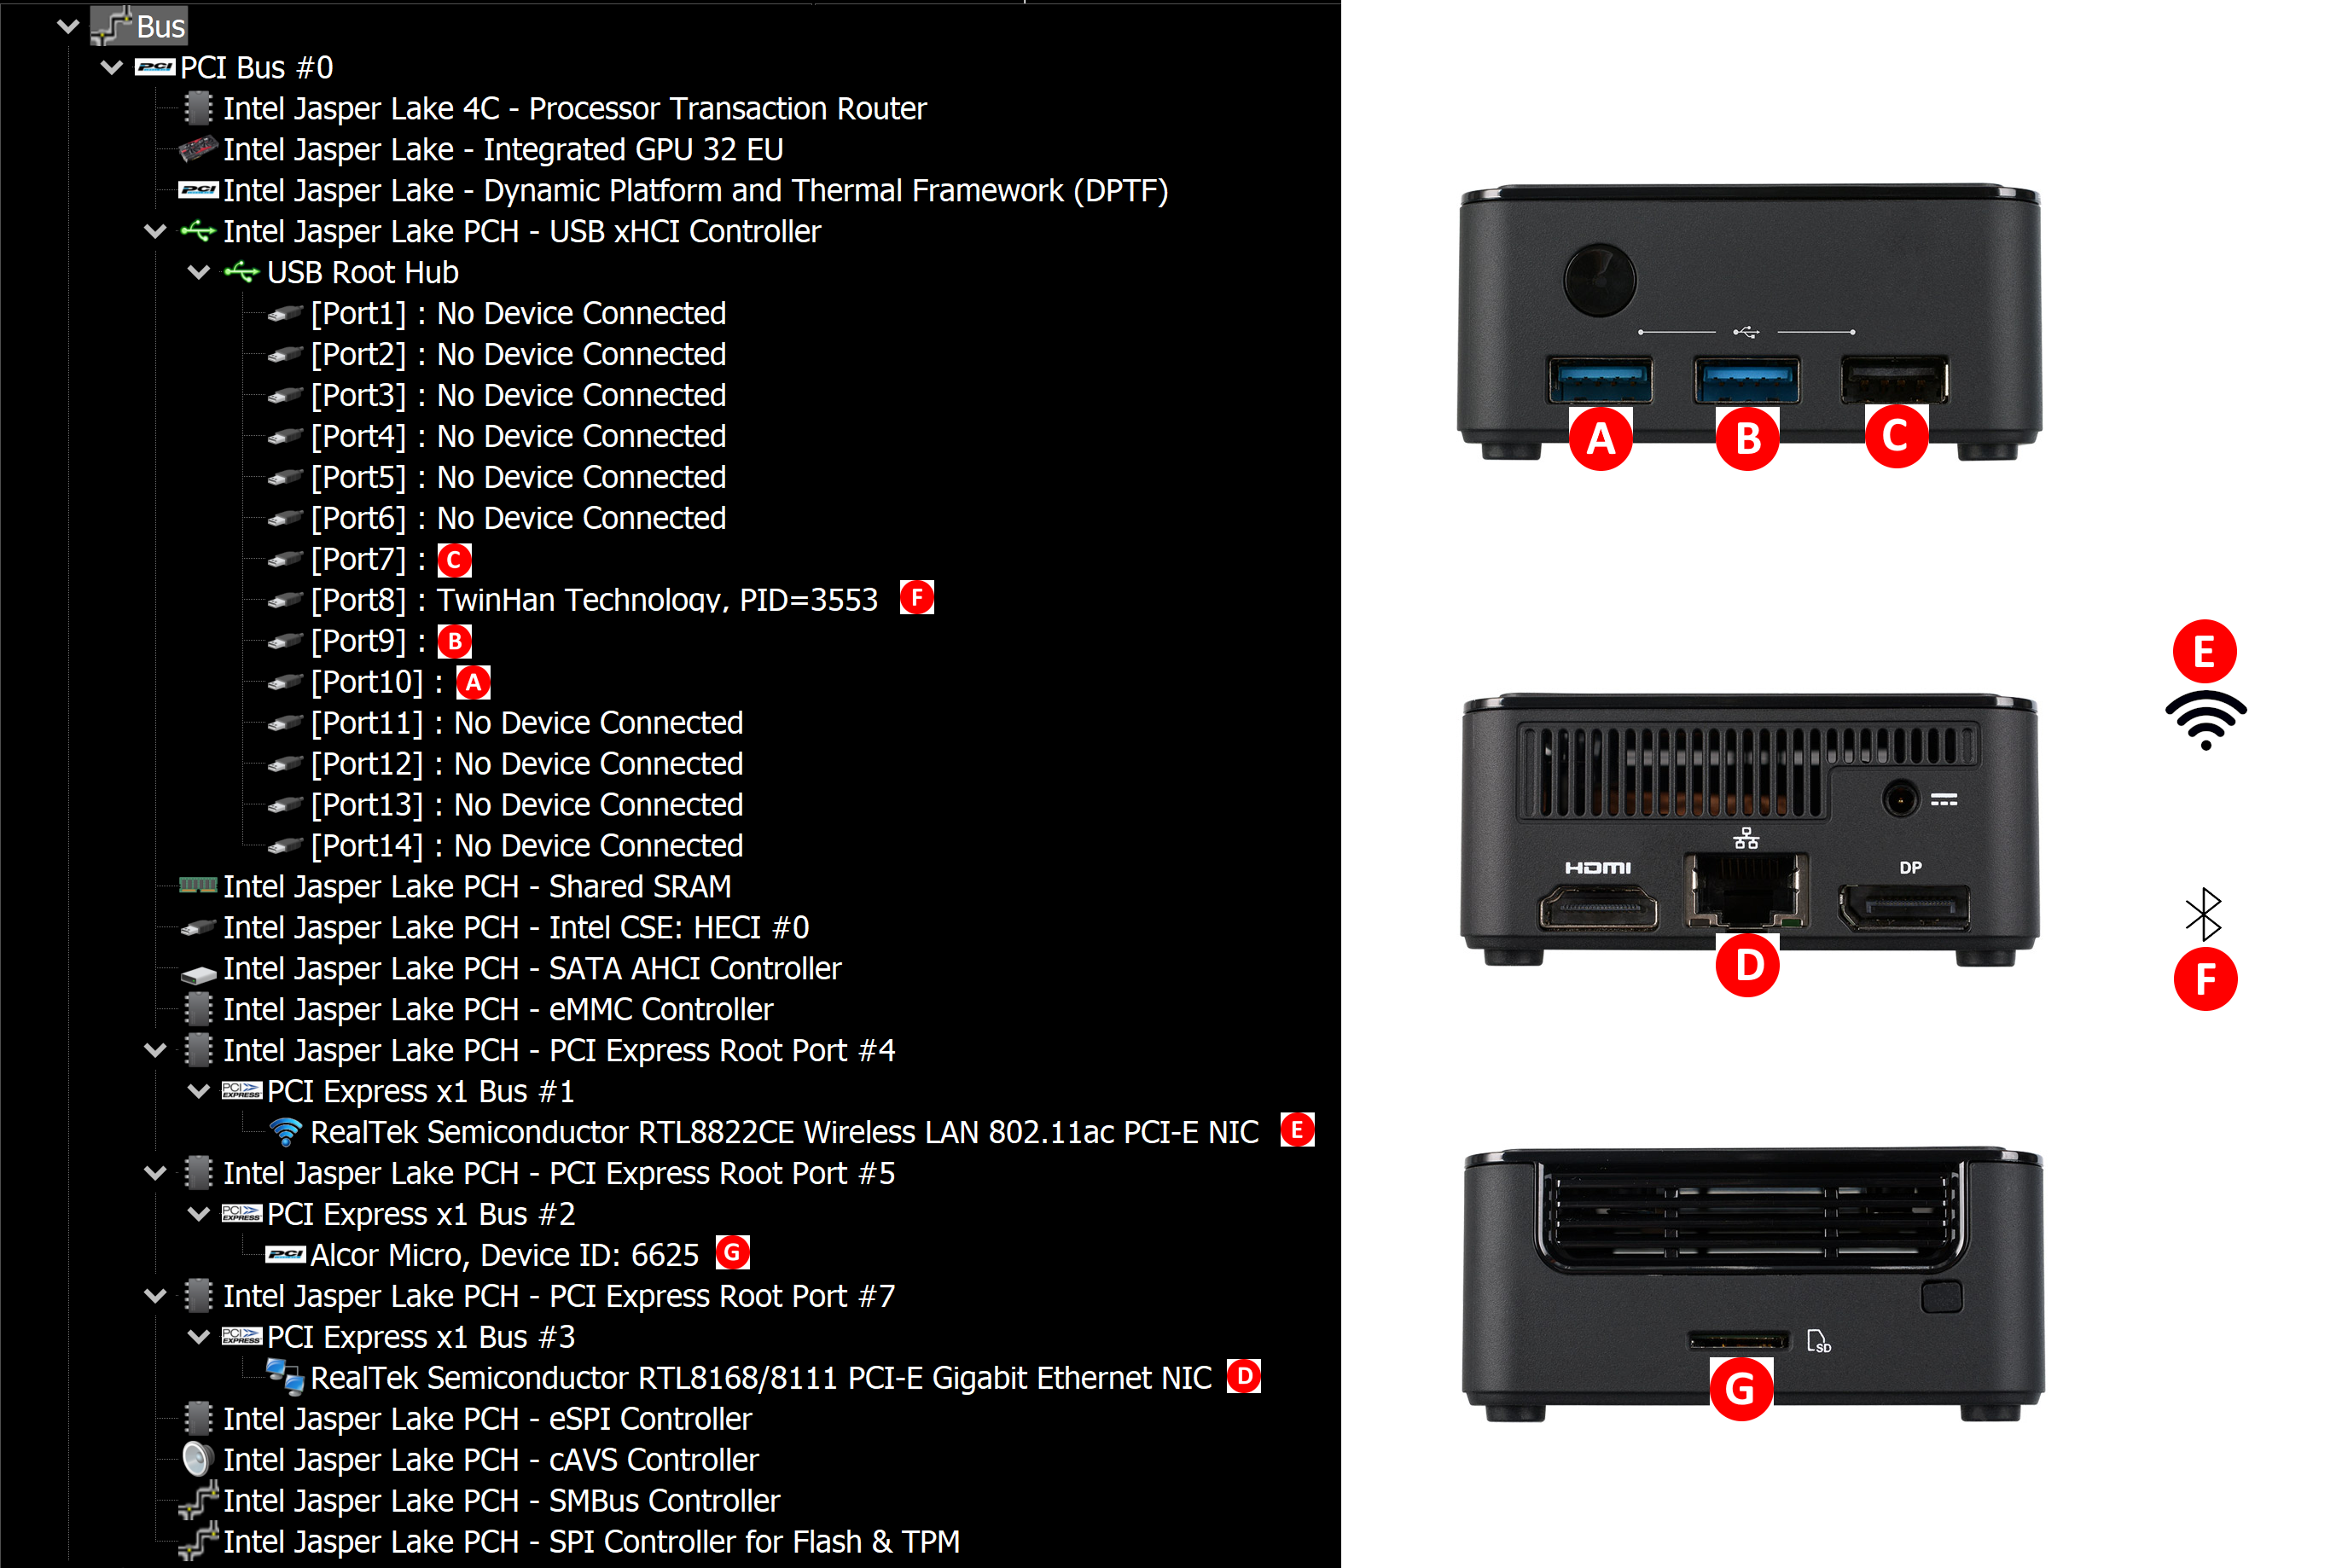
The distribution of high-speed I/O lanes is summarized below:
- PCIe 3.0 x1 #1: Realtek RTL8822CE WLAN 802.11ac PCIe NIC
- PCIe 3.0 x1 #2: Alcor Micro SD Card Reader Controller
- PCIe 3.0 x1 #3: Realtek RTL8168/8111 Gigabit Ethernet NIC
In today's review, we compare the ACEMAGIC T8 Plus and the ECS LIVA Q3D against a host of other systems based on processors with TDPs ranging from 6W to 28W. The systems do not target the same market segments, but a few key aspects lie in common, making the comparisons relevant.
| Comparative PC Configurations | ||
| Aspect | ACEMAGIC T8 Plus | |
| CPU | Intel Processor N95 Alder Lake-N 4C/4T, 1.7 - 3.4 GHz Intel 7, 6MB L3, 15W (PL1 = 15W / PL2 = 15W) |
Intel Processor N95 Alder Lake-N 4C/4T, 1.7 - 3.4 GHz Intel 7, 6MB L3, 15W (PL1 = 15W / PL2 = 15W) |
| GPU | Intel UHD Graphics (16EU @ 1200 MHz) |
Intel UHD Graphics (16EU @ 1200 MHz) |
| RAM | Samsung K3LKBKB0BM-MGCP LPDDR5-3200 (Single-Channel / 4 x16) 36-32-32-68 @ 3200 MHz 16 GB |
Samsung K3LKBKB0BM-MGCP LPDDR5-3200 (Single-Channel / 4 x16) 36-32-32-68 @ 3200 MHz 16 GB |
| Storage | Futurepath FPT310M4SSD512G (512 GB; SATA III 6 Gbps;) (?? NAND; ?? Controller) |
Futurepath FPT310M4SSD512G (512 GB; SATA III 6 Gbps;) (?? NAND; ?? Controller) |
| Wi-Fi | 2x GbE RJ-45 (Realtek RTL8168/8111) Realtek RTL8821CE Wi-Fi 5 / Bluetooth 4.2 (1x1 802.11ac - 433 Mbps) |
2x GbE RJ-45 (Realtek RTL8168/8111) Realtek RTL8821CE Wi-Fi 5 / Bluetooth 4.2 (1x1 802.11ac - 433 Mbps) |
| Price (in USD, when built) | (Street Pricing on Sep 18st, 2023) US $207 ($177) (with limited use / limited time coupon UQSYLW9R) |
(Street Pricing on Sep 18st, 2023) US $207 ($177) (with limited use / limited time coupon UQSYLW9R) |
The next few sections will deal with comparative benchmarks for the above systems.
System Performance: UL and BAPCo Benchmarks
Our 2022 Q4 update to the test suite for Windows 11-based systems carries over some of the standard benchmarks we have been using over the last several years. While UL's PCMark makes the list, we have opted to temporarily suspend reporting of BAPCo's SYSmark scores (pending fixture of the energy consumption aspect). Instead, BAPCO's CrossMark multi-platform benchmarking tool has been added to the set along with UL's Procyon suite. While CrossMark employs idle time compression and processes all workloads in an opaque manner, UL's Procyon processes real-world workloads with user interactions (like BAPCo's SYSmark). We have augmented the UL Procyon suite benchmark with our own custom energy measurement setup.
UL PCMark 10
UL's PCMark 10 evaluates computing systems for various usage scenarios (generic / essential tasks such as web browsing and starting up applications, productivity tasks such as editing spreadsheets and documents, gaming, and digital content creation). We benchmarked select PCs with the PCMark 10 Extended profile and recorded the scores for various scenarios. These scores are heavily influenced by the CPU and GPU in the system, though the RAM and storage device also play a part. The power plan was set to Balanced for all the PCs while processing the PCMark 10 benchmark. The scores for each contributing component / use-case environment are also graphed below.
| UL PCMark 10 - Performance Scores | |||
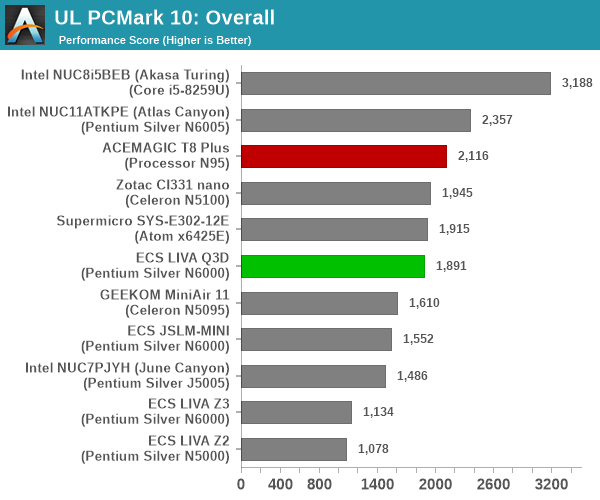
The ACEMAGIC T8 Plus enjoys a slight lead over the ECS LIVA Q3D in all the components, but the hopes of a significant generational update are somewhat dashed. This has more to do with the configured PL1 and PL2 values for both systems. ECS allows the Jasper Lake Pentium Silver N6000 to operate with PL1 and PL2 values of 10W and 25W despite its 6W TDP. On the other hand, ACEMAGIC's BIOS keeps these values same at 15W. The higher power budget allows the LIVA Q3D to put up creditable scores almost matching the newer generation T8 Plus in the PCMark 10 workloads.
UL Procyon v2.1.544
PCMark 10 utilizes open-source software such as Libre Office and GIMP to evaluate system performance. However, many of their professional benchmark customers have been requesting evaluation with commonly-used commercial software such as Microsoft Office and Adobe applications. In order to serve their needs, UL introduced the Procyon benchmark in late 2020. There are five benchmark categories currently - Office Productivity, AI Inference, Battery Life, Photo Editing, and Video Editing. AI Inference benchmarks are available only for Android devices, while the battery life benchmark is applicable to Windows devices such as notebooks and tablets. We presents results from our processing of the other three benchmarks.
We had been unable to process this benchmark on any of the Jasper Lake systems previously, and this didn't change with the ECS LIVA Q3D. The other compared systems are old ones on which we had not processed UL Procyon at all. Interestingly, the ADL-N-based T8 Plus completed the benchmark without any issues. We are recording the scores and energy consumption numbers for the T8 Plus here for use in future reviews.
| ACEMAGIC T8 Plus - UL Procyon 2.1.544 Scores and Energy Consumption | ||
| Workload | Score (Higher is Better) |
Energy Consumption (Wh) (Lower is Better) |
| Office Productivity - MS Excel | 3166 | |
| Office Productivity - MS Word | 4286 | |
| Office Productivity - MS Powerpoint | 3458 | |
| Office Productivity - MS Outlook | 3171 | |
| Office Productivity - Overall | 3541 | 7.5 |
| Photo Editing | 2539 | 10.31 |
| Video Editing | 876 | 69.38 |
Without a frame of reference, it is hard to evaluate the performance of the T8 Plus in this workload. We will get more context in future reviews of ADL-N-based systems.
BAPCo CrossMark 1.0.1.86
BAPCo's CrossMark aims to simplify benchmark processing while still delivering scores that roughly tally with SYSmark. The main advantage is the cross-platform nature of the tool - allowing it to be run on smartphones and tablets as well.
| BAPCo CrossMark 1.0.1.86 - Sub-Category Scores | |||
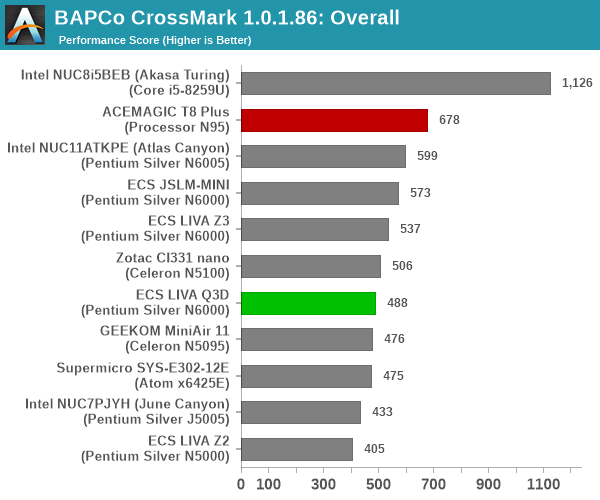
The relative performance seen in the UL PCMark 10 workloads also translate to BAPCo Crossmark. However, the gulf between the LIVA Q3D and the T8 Plus is much more pronounced due to the idle time compression scheme. This doesn't allow the processor in the LIVA Q3D to ramp up to 25W on a consistent basis, which pulls down the performance compared to ADL-N processor in the T8 Plus.
System Performance: Miscellaneous Workloads
Standardized benchmarks such as UL's PCMark 10 and BAPCo's SYSmark take a holistic view of the system and process a wide range of workloads to arrive at a single score. Some systems are required to excel at specific tasks - so it is often helpful to see how a computer performs in specific scenarios such as rendering, transcoding, JavaScript execution (web browsing), etc. This section presents focused benchmark numbers for specific application scenarios.
3D Rendering - CINEBENCH R23
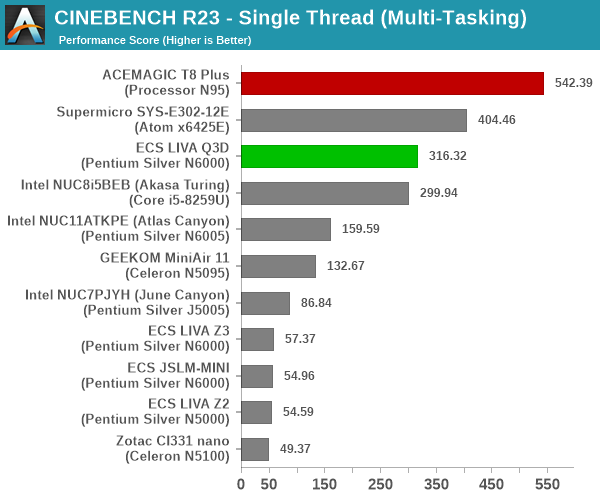
We use CINEBENCH R23 for 3D rendering evaluation. R23 provides two benchmark modes - single threaded and multi-threaded. Evaluation of different PC configurations in both supported modes provided us the following results.
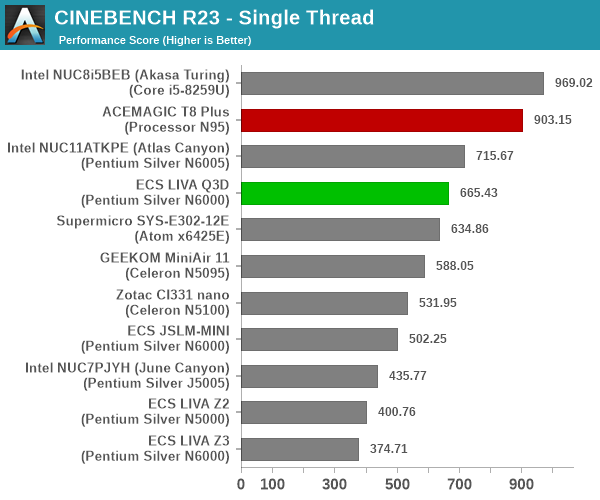
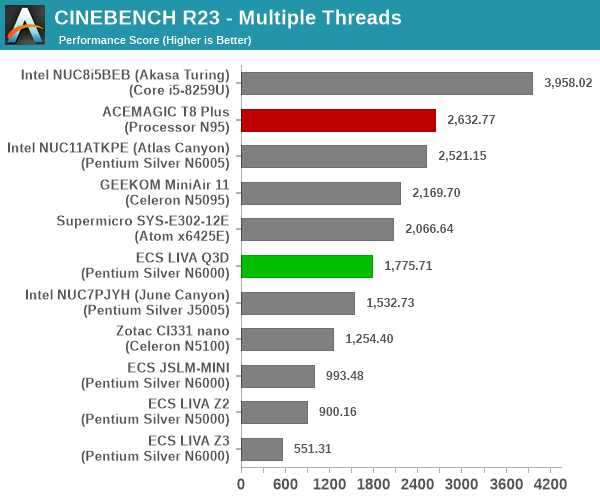
The LIVA Q3D delivers performance expected out of Jasper Lake, unlike the passively-cooled ECS LIVA Z3 which throttled heavily. However, the T8 Plus's score is the surprise package. Despite using an Atom-class microarchitecture, the performance almost reaches the levels seen in the Coffee Lake-U processors for single-threaded performance. With multiple threads in the picture, the comparison is not as rosy, but the relative ordering remains the same. The T8 Plus is well ahead of other Atom-based competitors.
Transcoding: Handbrake 1.5.1
Handbrake is one of the most user-friendly open source transcoding front-ends in the market. It allows users to opt for either software-based higher quality processing or hardware-based fast processing in their transcoding jobs. Our new test suite uses the 'Tears of Steel' 4K AVC video as input and transcodes it with a quality setting of 19 to create a 720p AVC stream and a 1080p HEVC stream.
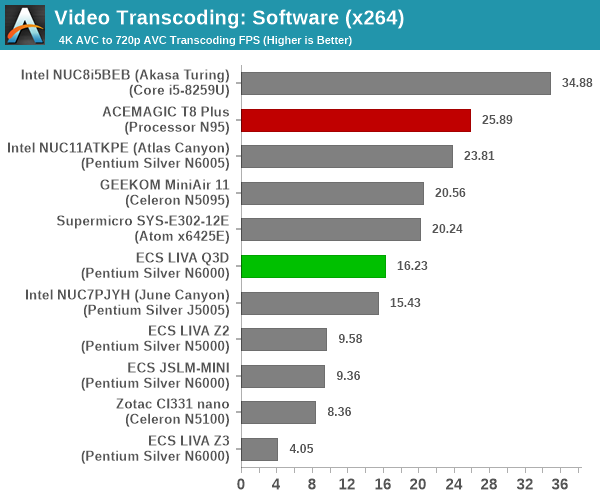
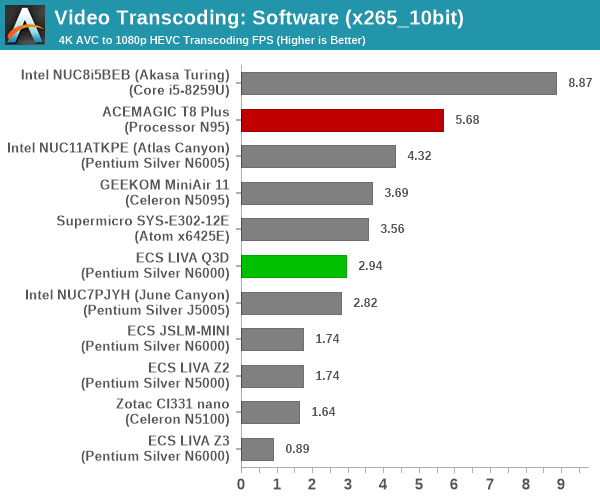
The presence of newer generation cores in the T8 Plus gives it a very good advantage for this multi-threaded benchmark. With all systems using processors with similar core counts, higher power budget translates to higher performance. The 15W configuration of the Intel Processor N95 (compared to the 6W / 10W ones in other systems using a similar class of processors) is the deciding factor in this benchmark.
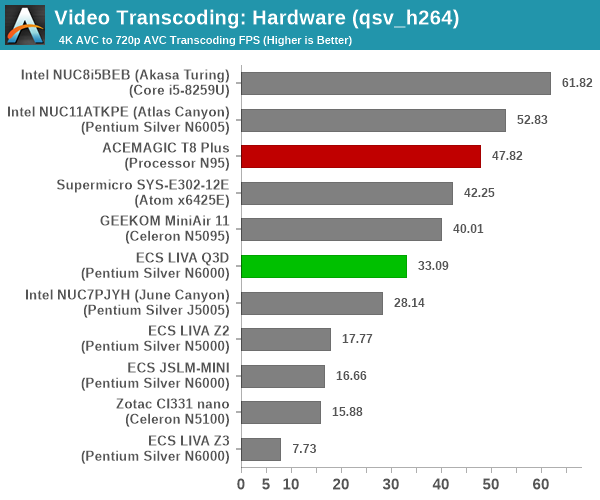
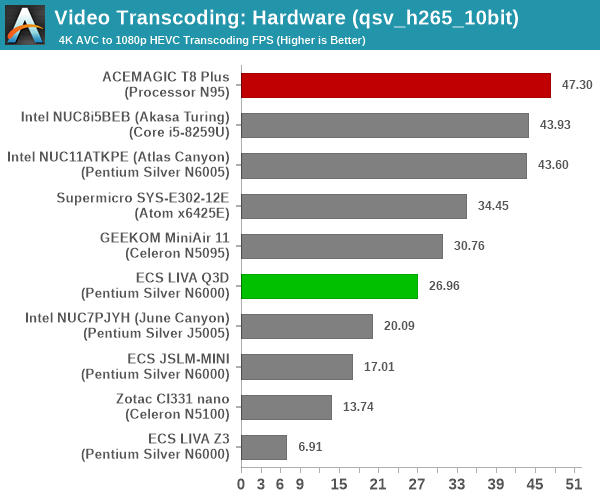
Hardware-accelerated transcoding rates are a function of GPU clock rates and power budget. While the clock rate advantage is evident in the H265 benchmark, the Atlas Canyon NUC surpasses the T8 Plus in the H264 one. A reason for this could be the 25W PL2 that may allow the QuickSync engine to run faster. It is possible that improvements to the engine for H265 in the newer processor may contribute to its leading performance for that codec.
Archiving: 7-Zip 21.7
The 7-Zip benchmark is carried over from our previous test suite with an update to the latest version of the open source compression / decompression software.
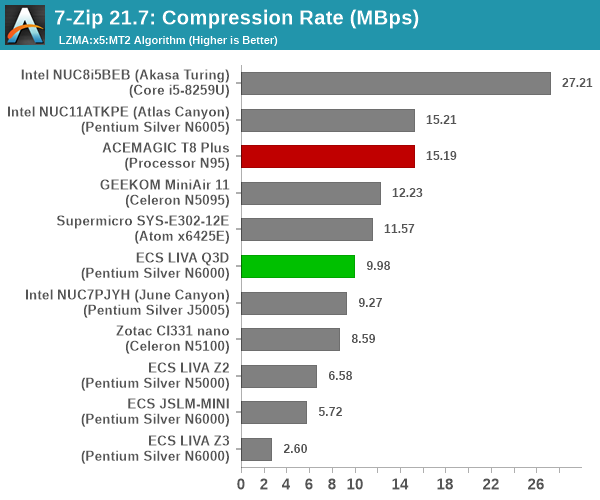
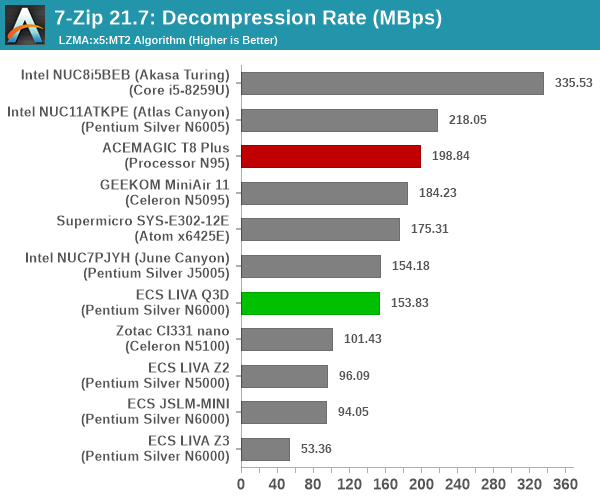
While the ADL-N in T8 Plus manages to handily best the LIVA Q3D's Jasper Lake, the Atlas Canyon NUC with a souped up Jasper Lake processor (PL2 at 25W) enjoys a slight edge over the T8 Plus.
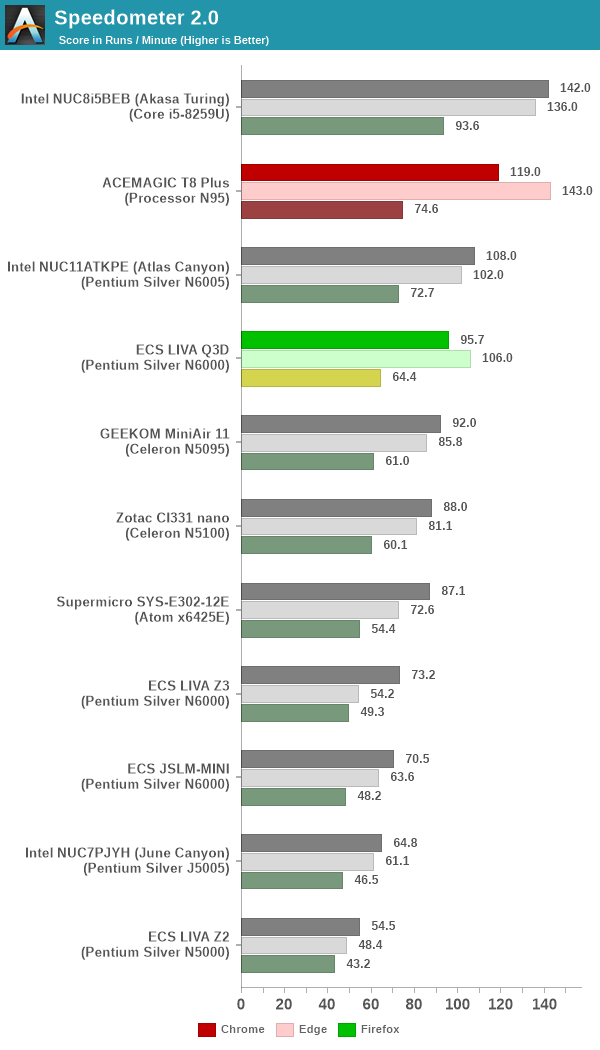
Web Browsing: JetStream, Speedometer, and Principled Technologies WebXPRT4
Web browser-based workloads have emerged as a major component of the typical home and business PC usage scenarios. For headless systems, many applications based on JavaScript are becoming relevant too. In order to evaluate systems for their JavaScript execution efficiency, we are carrying over the browser-focused benchmarks from the WebKit developers used in our notebook reviews. Hosted at BrowserBench, JetStream 2.0 benchmarks JavaScript and WebAssembly performance, while Speedometer measures web application responsiveness.
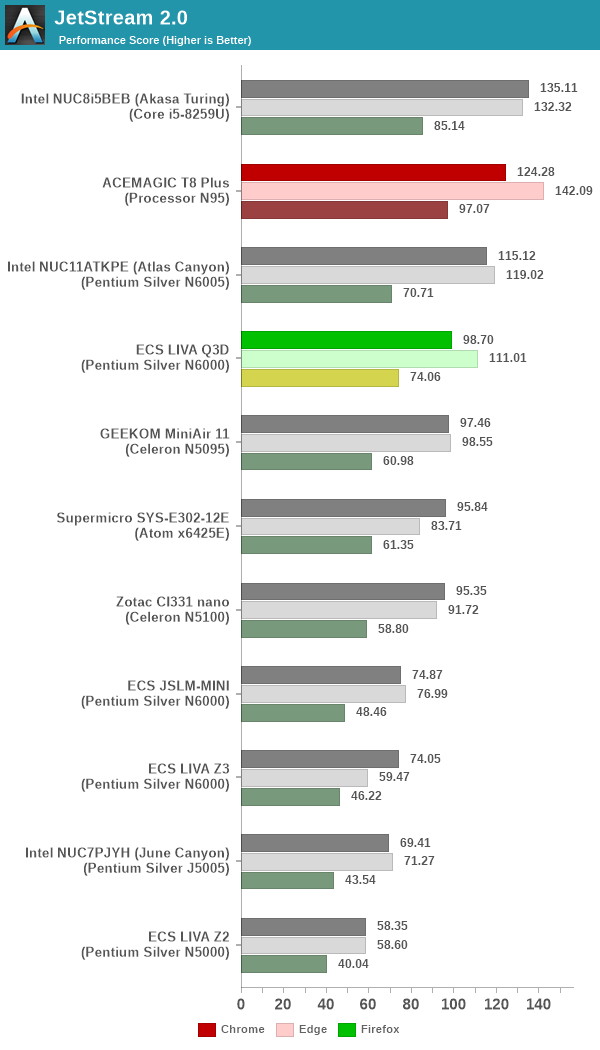
From a real-life workload perspective, we also process WebXPRT4 from Principled Technologies. WebXPRT4 benchmarks the performance of some popular JavaScript libraries that are widely used in websites.
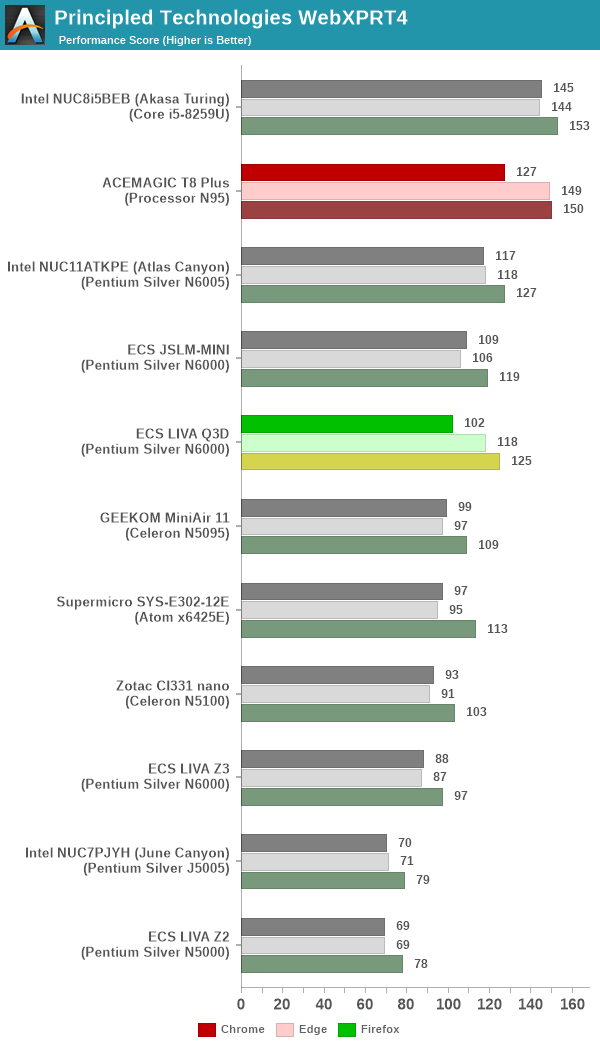
As expected from previous benchmarks, the T8 Plus has the edge over the LIVA Q3D. The surprise here is that ADL-N is almost as good as CFL-U with a much higher power budget in the passively-cooled Bean Canyon NUC.
Application Startup: GIMP 2.10.30
A new addition to our systems test suite is AppTimer - a benchmark that loads up a program and determines how long it takes for it to accept user inputs. We use GIMP 2.10.30 with a 50MB multi-layered xcf file as input. What we test here is the first run as well as the cached run - normally on the first time a user loads the GIMP package from a fresh install, the system has to configure a few dozen files that remain optimized on subsequent opening. For our test we delete those configured optimized files in order to force a ???fresh load??? every second time the software is run.
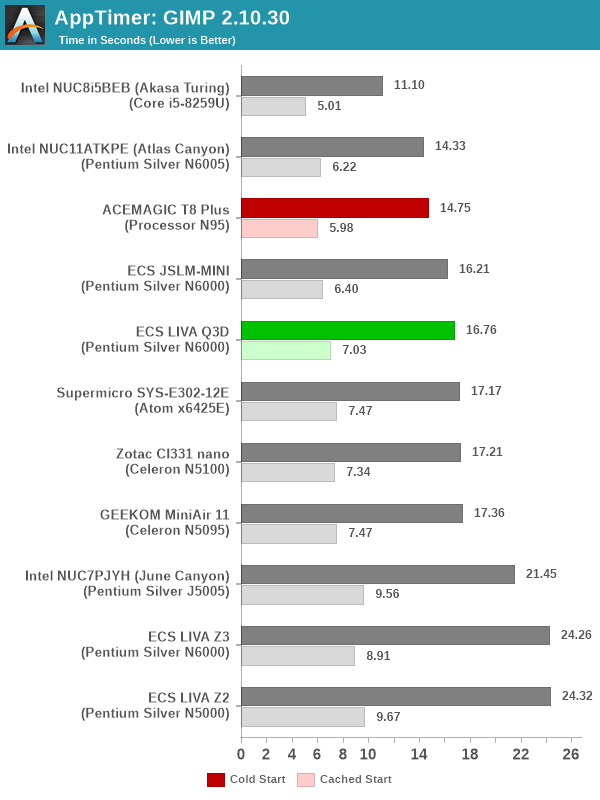
As it turns out, GIMP does optimizations for every CPU thread in the system, which requires that higher thread-count processors take a lot longer to run. So the test runs quick on systems with fewer threads, however fast cores are also needed. Coffee Lake-U has a significant advantage here. The Gracemont cores in the T8 Plus do a creditable job and make the system perform as well as the Atlas Canyon NUC despite the latter's higher PL2 settings.
Cryptography Benchmarks
Cryptography has become an indispensable part of our interaction with computing systems. Almost all modern systems have some sort of hardware-acceleration for making cryptographic operations faster and more power efficient. In the case of IoT servers, many applications - including web server functionality and VPN - need cryptography acceleration.
BitLocker is a Windows features that encrypts entire disk volumes. While drives that offer encryption capabilities are dealt with using that feature, most legacy systems and external drives have to use the host system implementation. Windows has no direct benchmark for BitLocker. However, we cooked up a BitLocker operation sequence to determine the adeptness of the system at handling BitLocker operations. We start off with a 4.5GB RAM drive in which a 4GB VHD (virtual hard disk) is created. This VHD is then mounted, and BitLocker is enabled on the volume. Once the BitLocker encryption process gets done, BitLocker is disabled. This triggers a decryption process. The times taken to complete the encryption and decryption are recorded. This process is repeated 25 times, and the average of the last 20 iterations is graphed below.
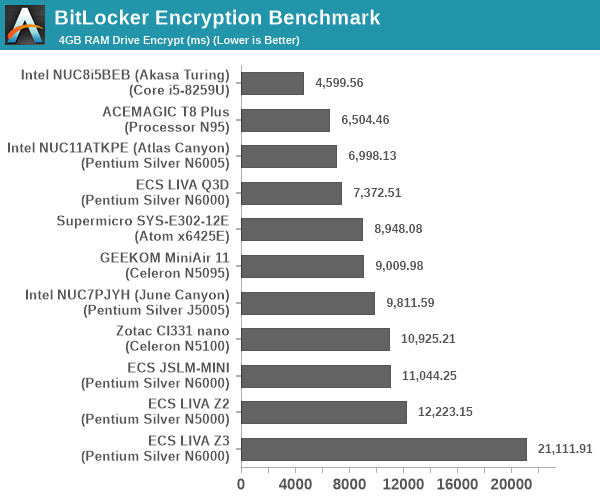

Hardware acceleration is available for the operations in all of the systems. The time taken for processing is directly dependent on the available power budget.
GPU Performance: Synthetic Benchmarks
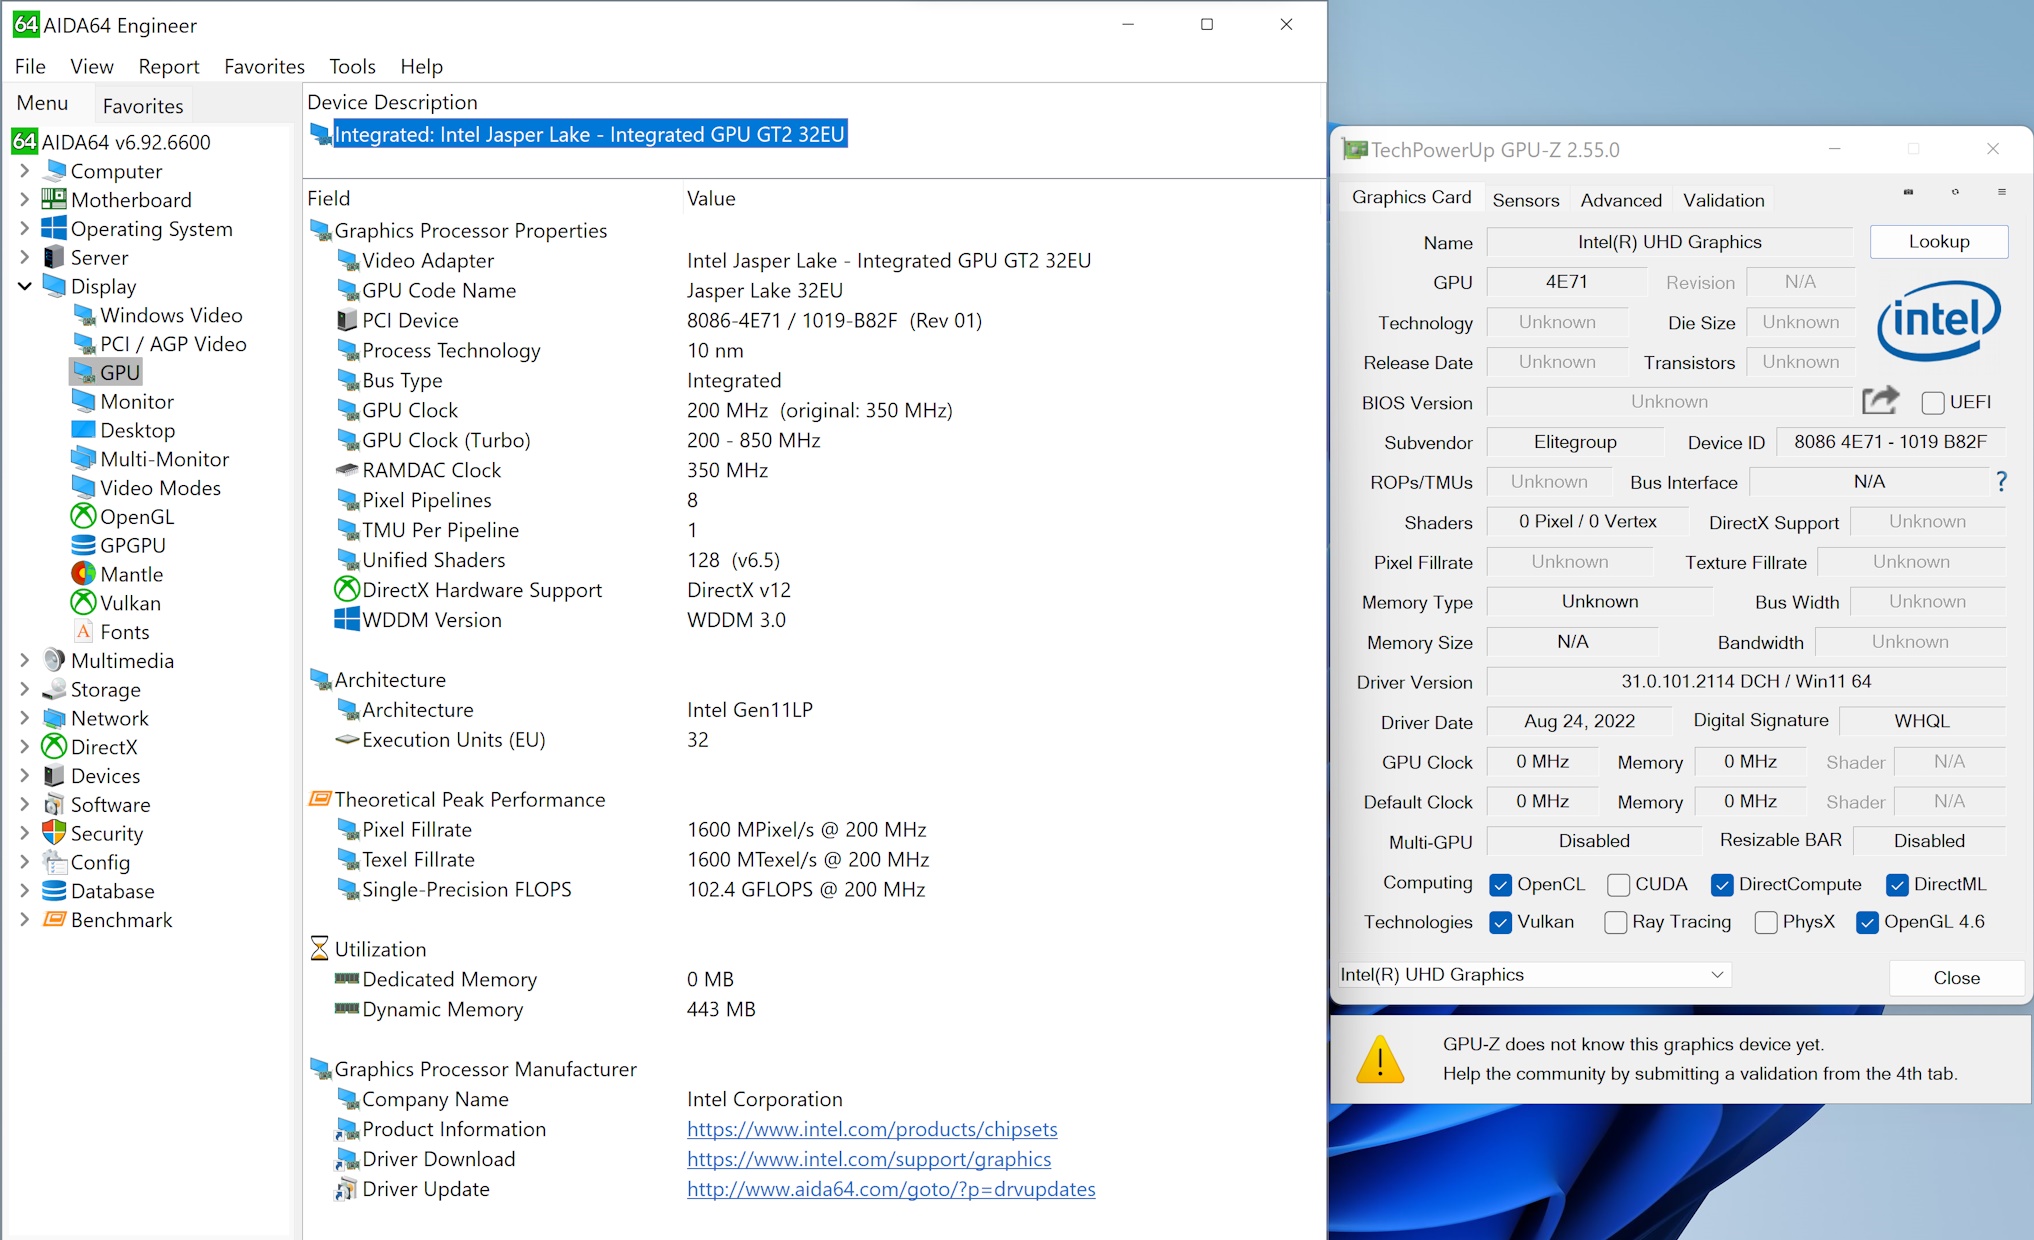
The integrated GPU in Jasper Lake uses a very old microarchitecture tracing its roots back to Gemini Lake. On the other hand, the one in Alder Lake-N uses a pared-down version of the one used in Alder Lake. As a result, the comparison between the T8 Plus and the LIVA Q3D promises to be an interesting one. The latter has 32 EUs clocked at 850 MHz, while the former has 16 EUs at 1200 MHz. Keeping these aspects in mind, the GPU performance has to be evaluated in the context of each workload. We put the systems through some standard 3D workloads to get an idea of what they have to offer for GPU-intensive tasks. Prior to that, a detailed look at the capabilities of the GPU is warranted.
GPU-Z (as of v2.55.0) still doesn't recognize the iGPU in Jasper Lake, but AIDA64 is able to provide all the necessary details.
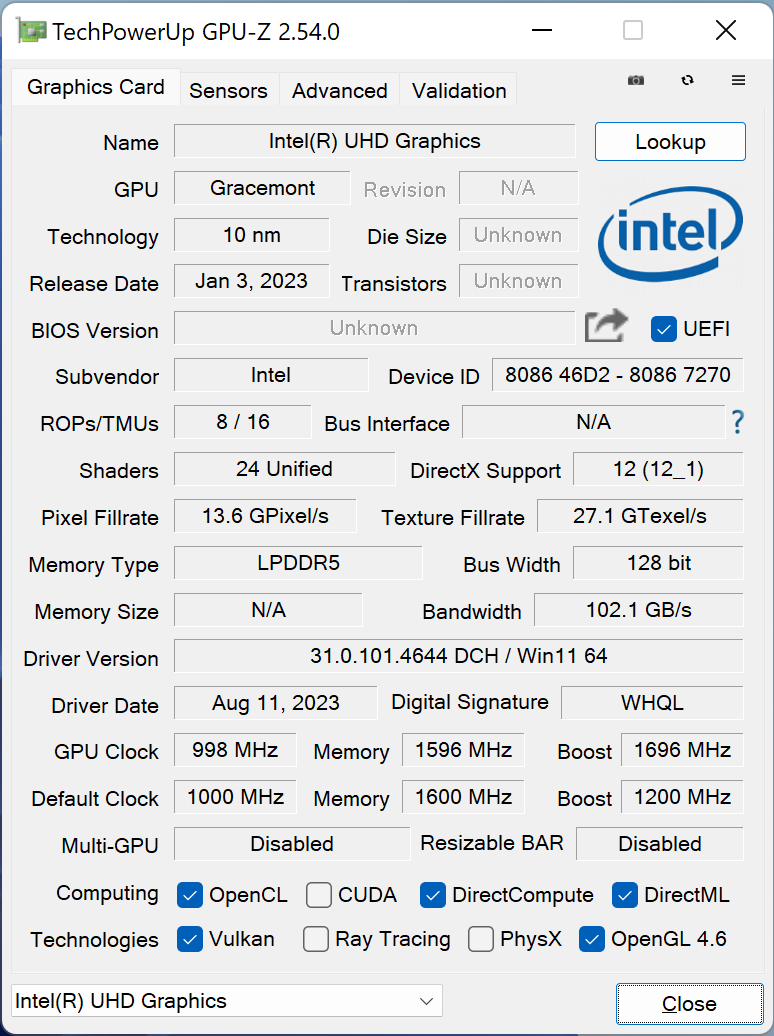
On the other hand, Alder Lake-N had no identification issues.
The remaining subsections below look into the performance aspects.
GFXBench
The DirectX 12-based GFXBench tests from Kishonti are cross-platform, and available all the way down to smartphones. As such, they are not very taxing for discrete GPUs and modern integrated GPUs. We processed the offscreen versions of the 'Aztec Ruins' benchmark.
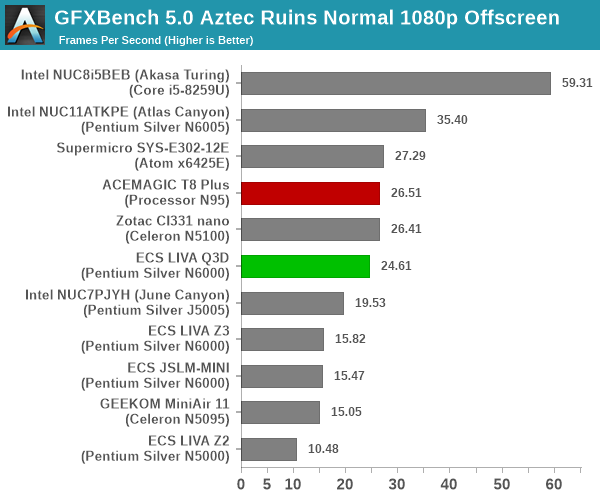
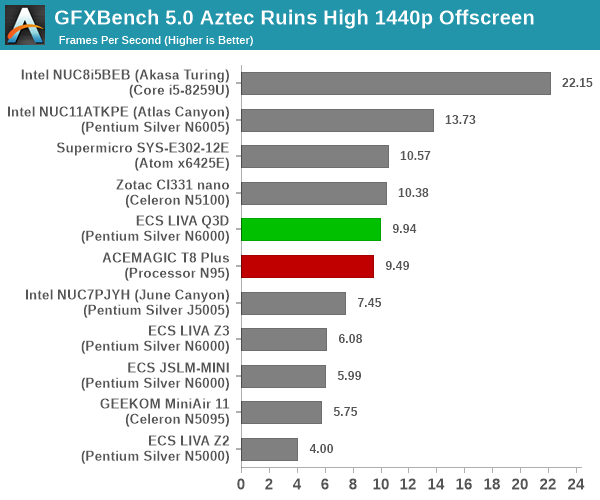
The newer T8 Plus delivers better performance than the LIVA Q3D. However, Jasper Lake systems with higher power budgets manage to easily surpass the performance of the T8 Plus.
UL 3DMark
Four different workload sets were processed in 3DMark - Fire Strike, Time Spy, Night Raid, and Wild Life.
3DMark Fire Strike
The Fire Strike benchmark has three workloads. The base version is meant for high-performance gaming PCs. It uses DirectX 11 (feature level 11) to render frames at 1920 x 1080. The Extreme version targets 1440p gaming requirements, while the Ultra version targets 4K gaming system, and renders at 3840 x 2160. The graph below presents the overall score for the Fire Strike Extreme and Fire Strike Ultra benchmark across all the systems that are being compared.
| UL 3DMark - Fire Strike Workloads | |||

The T8 Plus has a slight edge over the LIVA Q3D in these two workloads, but the Atlas Canyon NUC with its higher power budget remains the best in class among the Atom-based systems.
3DMark Time Spy
The Time Spy workload has two levels with different complexities. Both use DirectX 12 (feature level 11). However, the plain version targets high-performance gaming PCs with a 2560 x 1440 render resolution, while the Extreme version renders at 3840 x 2160 resolution. The graphs below present both numbers for all the systems that are being compared in this review.
| UL 3DMark - Time Spy Workloads | |||
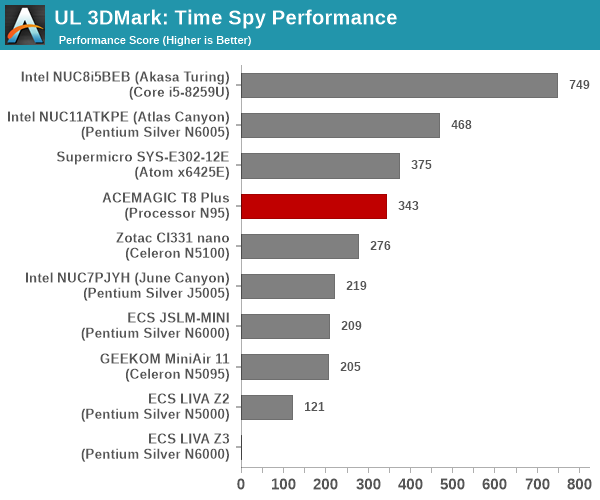
We were unable to process Time Spy and succeeding workloads completely on the LIVA Q3D (similar problem to what we faced with the LIVA Z3), but the score of the T8 Plus sees it maintain the same ordering as what was observed in the previous workloads.
3DMark Wild Life and Night Raid
The Wild Life workload was initially introduced as a cross-platform GPU benchmark in 2020. It renders at a 2560 x 1440 resolution using Vulkan 1.1 APIs on Windows. It is a relatively short-running test, reflective of mobile GPU usage. In mid-2021, UL released the Wild Life Extreme workload that was a more demanding version that renders at 3840 x 2160 and runs for a much longer duration reflective of typical desktop gaming usage.
| UL 3DMark - Wild Life Workloads | |||
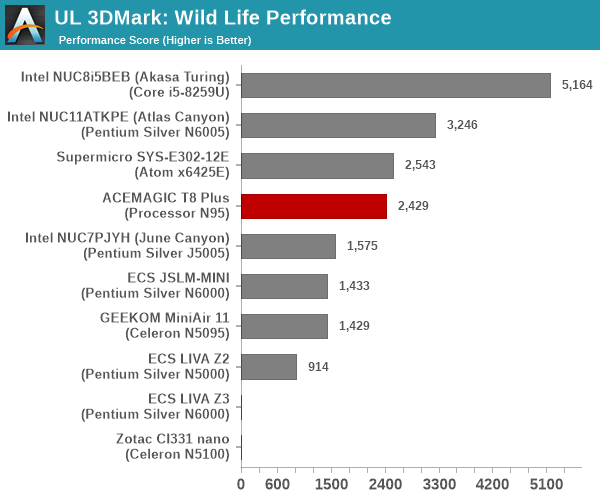
The Night Raid workload is a DirectX 12 benchmark test. It is less demanding than Time Spy, and is optimized for integrated graphics. The graph below presents the overall score in this workload for different system configurations.
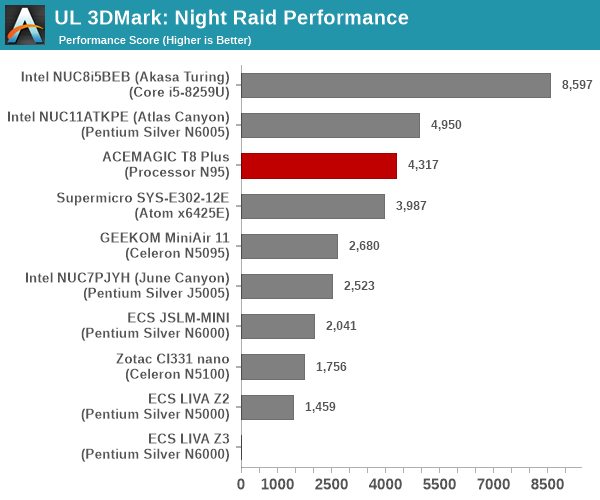
The higher power budget and EU count in the Atlas Canyon NUC again sees the T8 Plus slipping behind it in the Night Raid workload as well as the Wild Life one.
System Performance: Multi-Tasking
One of the key drivers of advancements in computing systems is multi-tasking. On mobile devices, this is quite lightweight - cases such as background email checks while the user is playing a mobile game are quite common. Towards optimizing user experience in those types of scenarios, mobile SoC manufacturers started integrating heterogenous CPU cores - some with high performance for demanding workloads, while others were frugal in terms of both power consumption / die area and performance. This trend is now slowly making its way into the desktop PC space. However, both systems we are looking at today - the LIVA Q3D and the T8 Plus employ only the frugal cores.
Multi-tasking in typical PC usage is much more demanding compared to phones and tablets. Desktop OSes allow users to launch and utilize a large number of demanding programs simultaneously. Responsiveness is dictated largely by the OS scheduler allowing different tasks to move to the background. The processor is required to work closely with the OS thread scheduler to optimize performance in these cases. Keeping these aspects in mind, the evaluation of multi-tasking performance is an interesting subject to tackle.
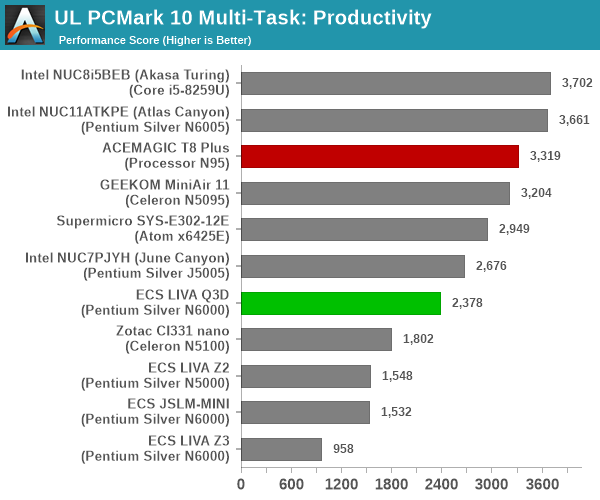
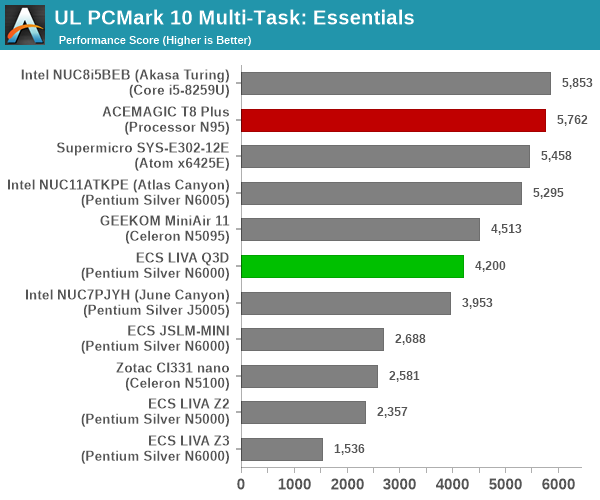
We have augmented our systems benchmarking suite to quantitatively analyze the multi-tasking performance of various platforms. The evaluation involves triggering a ffmpeg transcoding task to transform 1716 3840x1714 frames encoded as a 24fps AVC video (Blender Project's 'Tears of Steel' 4K version) into a 1080p HEVC version in a loop. The transcoding rate is monitored continuously. One complete transcoding pass is allowed to complete before starting the first multi-tasking workload - the PCMark 10 Extended bench suite. A comparative view of the PCMark 10 scores for various scenarios is presented in the graphs below. Also available for concurrent viewing are scores in the normal case where the benchmark was processed without any concurrent load, and a graph presenting the loss in performance.
| UL PCMark 10 Load Testing - Digital Content Creation Scores | |||

| UL PCMark 10 Load Testing - Productivity Scores | |||
| UL PCMark 10 Load Testing - Essentials Scores | |||
| UL PCMark 10 Load Testing - Gaming Scores | |||

| UL PCMark 10 Load Testing - Overall Scores | |||

Since none of the systems being considered in the graph above have heterogeneous cores, it is no surprise that the relative ordering of various systems remains the same irrespective of the presence of concurrent loading.
Following the completion of the PCMark 10 benchmark, a short delay is introduced prior to the processing of Principled Technologies WebXPRT4 on MS Edge. Similar to the PCMark 10 results presentation, the graph below show the scores recorded with the transcoding load active. Available for comparison are the dedicated CPU power scores and a measure of the performance loss.
| Principled Technologies WebXPRT4 Load Testing Scores (MS Edge) | |||
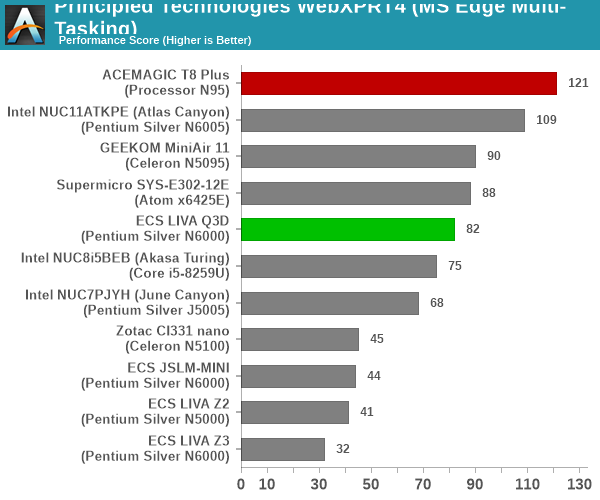
In the absence of thermal throttling, the systems have minimal performance loss. The ones with a higher PL1 / PL2 value fare better in that aspect.
The final workload tested as part of the multitasking evaluation routine is CINEBENCH R23.
| 3D Rendering - CINEBENCH R23 Load Testing - Single Thread Score | |||
| 3D Rendering - CINEBENCH R23 Load Testing - Multiple Thread Score | |||
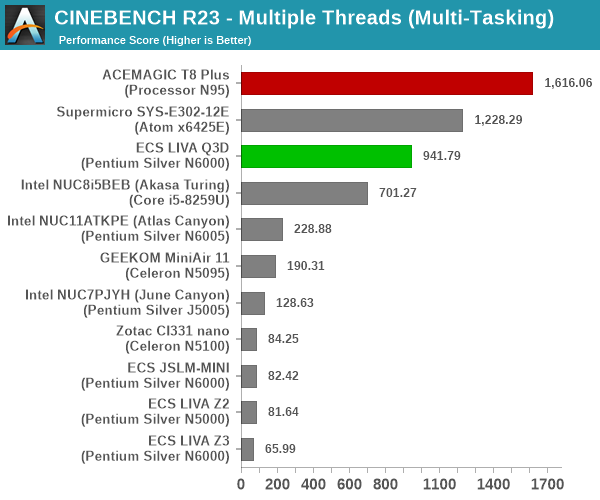
Similar to software transcoding, rendering is also quite CPU intensive with barely any recovery time possible for the CPU between operations. Therefore, it is no surprise that loss in performance ranges from 35% to 90%. A look at the impact to the transcoding rate during this segment would provide more insight on how the system handles concurrent workloads.
After the completion of all the workloads, we let the transcoding routine run to completion. The monitored transcoding rate throughout the above evaluation routine (in terms of frames per second) is graphed below.
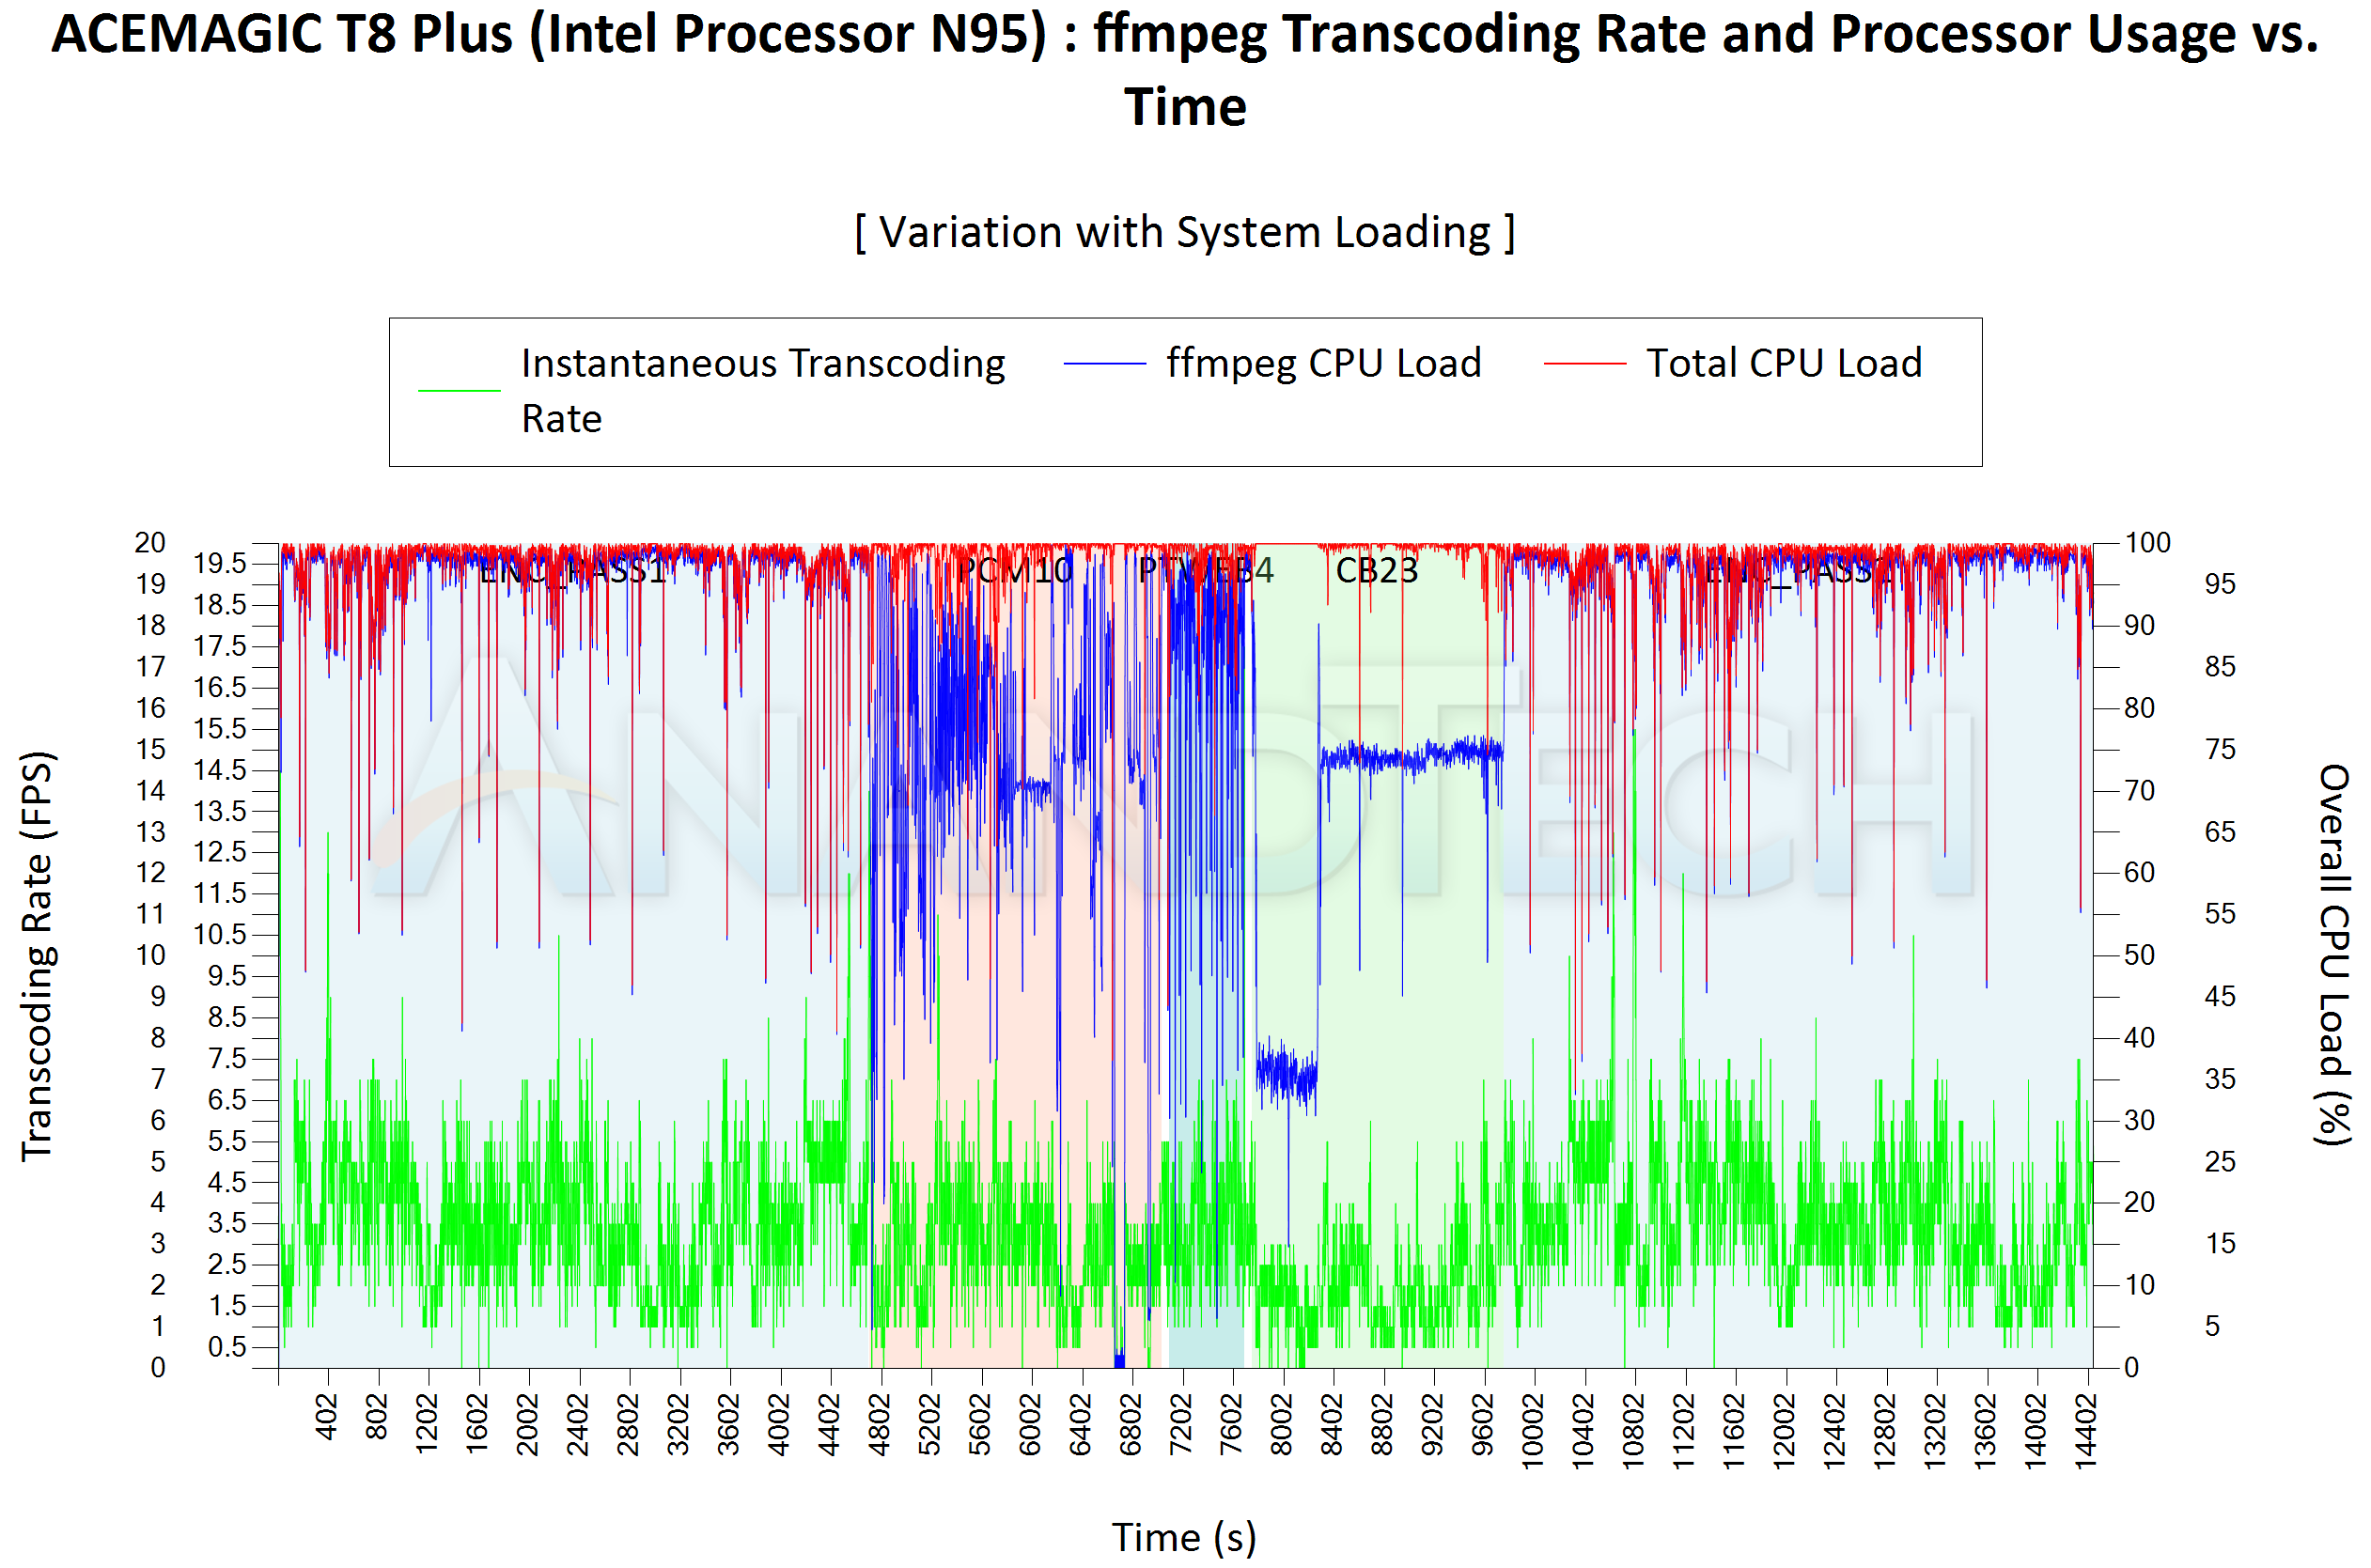
| ACEMAGIC T8 Plus (Intel Processor N95) ffmpeg Transcoding Rate (Multi-Tasking Test) | |||
| Task Segment | Transcoding Rate (FPS) | ||
| Minimum | Average | Maximum | |
| Transcode Start Pass | 0 | 3.75 | 18.5 |
| PCMark 10 | 0 | 2.89 | 14 |
| WebXPRT 4 | 1 | 3.5 | 7 |
| Cinebench R23 | 0 | 1.99 | 7 |
| Transcode End Pass | 0 | 3.76 | 15.5 |
A similar set of results for the LIVA Q3D is presented below.
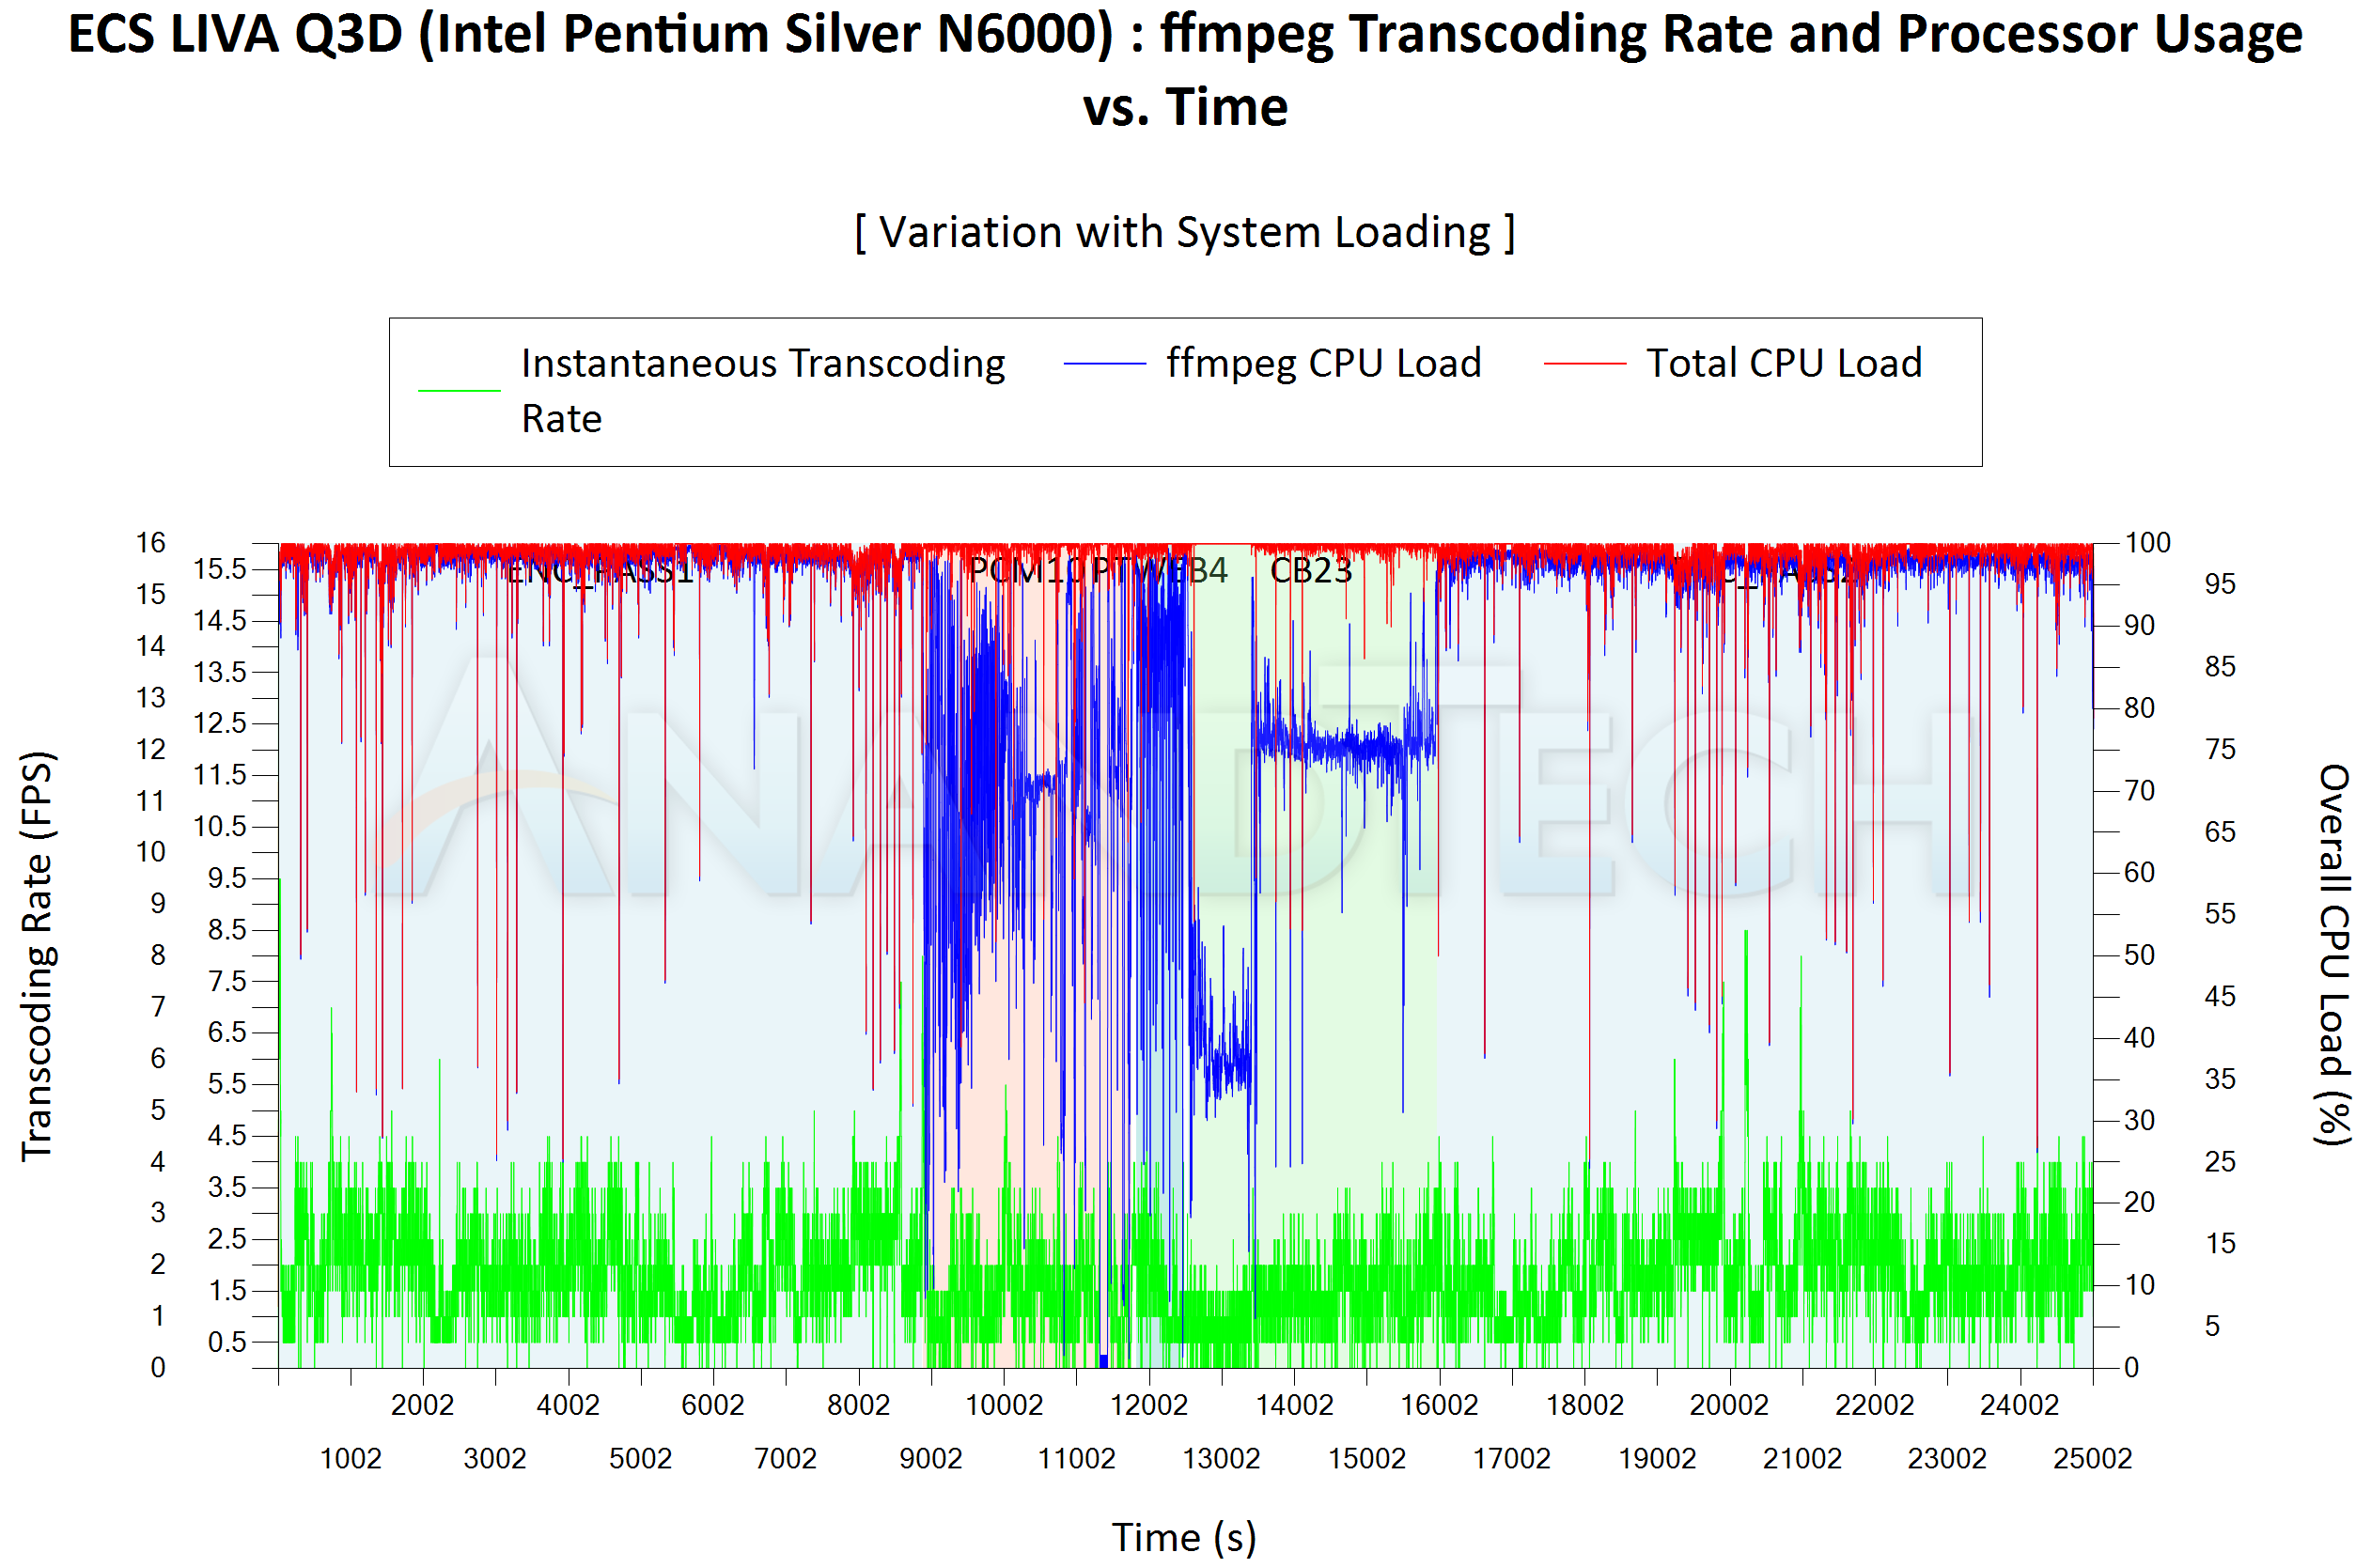
| ECS LIVA Q3D (Intel Pentium Silver N6000) ffmpeg Transcoding Rate (Multi-Tasking Test) | |||
| Task Segment | Transcoding Rate (FPS) | ||
| Minimum | Average | Maximum | |
| Transcode Start Pass | 0 | 1.99 | 14.5 |
| PCMark 10 | 0 | 1.42 | 7 |
| WebXPRT 4 | 0 | 1.53 | 4.5 |
| Cinebench R23 | 0 | 1.32 | 4 |
| Transcode End Pass | 0 | 1.95 | 8.5 |
The absolute numbers for the T8 Plus are much better than that of the LIVA Q3D, as expected from a newer generation system. The actual delta in the Cinebench segment is therefore worse for the T8 Plus compared to the LIVA Q3D, but the absolute numbers end up making for a better user experience with the ADL-N system under these types of loading conditions.
HTPC Credentials
The 2022 Q4 update to our system reviews brings an updated HTPC evaluation suite for systems. After doing away with the evaluation of display refresh rate stability and Netflix streaming evaluation, the local media playback configurations have also seen a revamp. This section details each of the workloads processed on the ACEMAGIC T8 Plus as part of the HTPC suite.
YouTube Streaming Efficiency
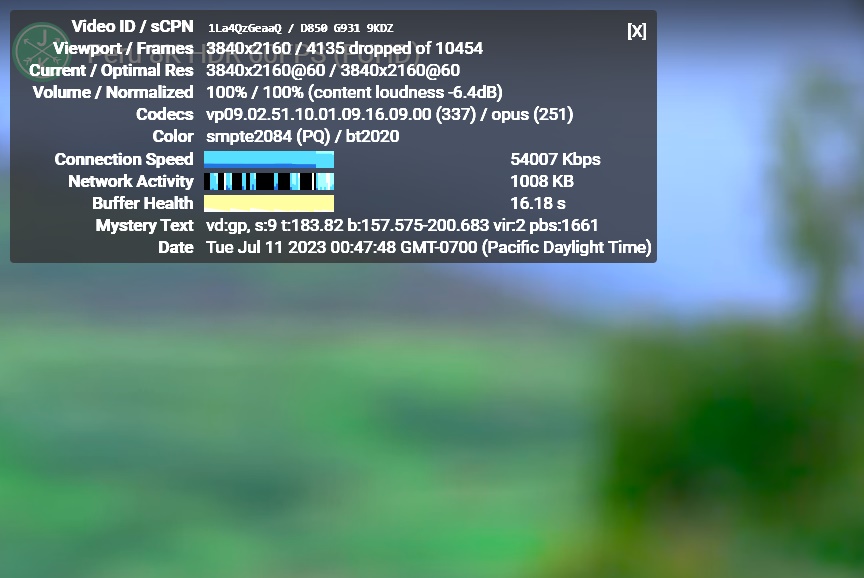
YouTube continues to remain one of the top OTT platforms, primarily due to its free ad-supported tier. Our HTPC test suite update retains YouTube streaming efficiency evaluation as a metric of OTT support in different systems. Mystery Box's Peru 8K HDR 60FPS video is the chosen test sample. On PCs running Windows, it is recommended that HDR streaming videos be viewed using the Microsoft Edge browser after putting the desktop in HDR mode. We were unable to get HDR working in the T8 Plus. Online forum posts suggest the need to install and configure the video output in the Intel Graphics Control application for HDMI ports driven using the DP outputs of the SoC. We opted to go ahead with non-HDR evaluation for the T8 Plus.

ACEMAGIC T8 Plus YouTube Streaming Statistics
ECS LIVA Q3D YouTube Streaming Statistics
The GPU in both systems should have no problem decoding VP9 Profile 2 videos theoretically. However, we found the LIVA Q3D having choppy playback with many dropped frames, particularly during the activation of overlays on the video. The ACEMAGIC T8 Plus had minimum problems with the non-HDR stream.
The streaming efficiency-related aspects such as GPU usage and at-wall power consumption are also graphed below.
| YouTube Network Streaming Efficiency | |||
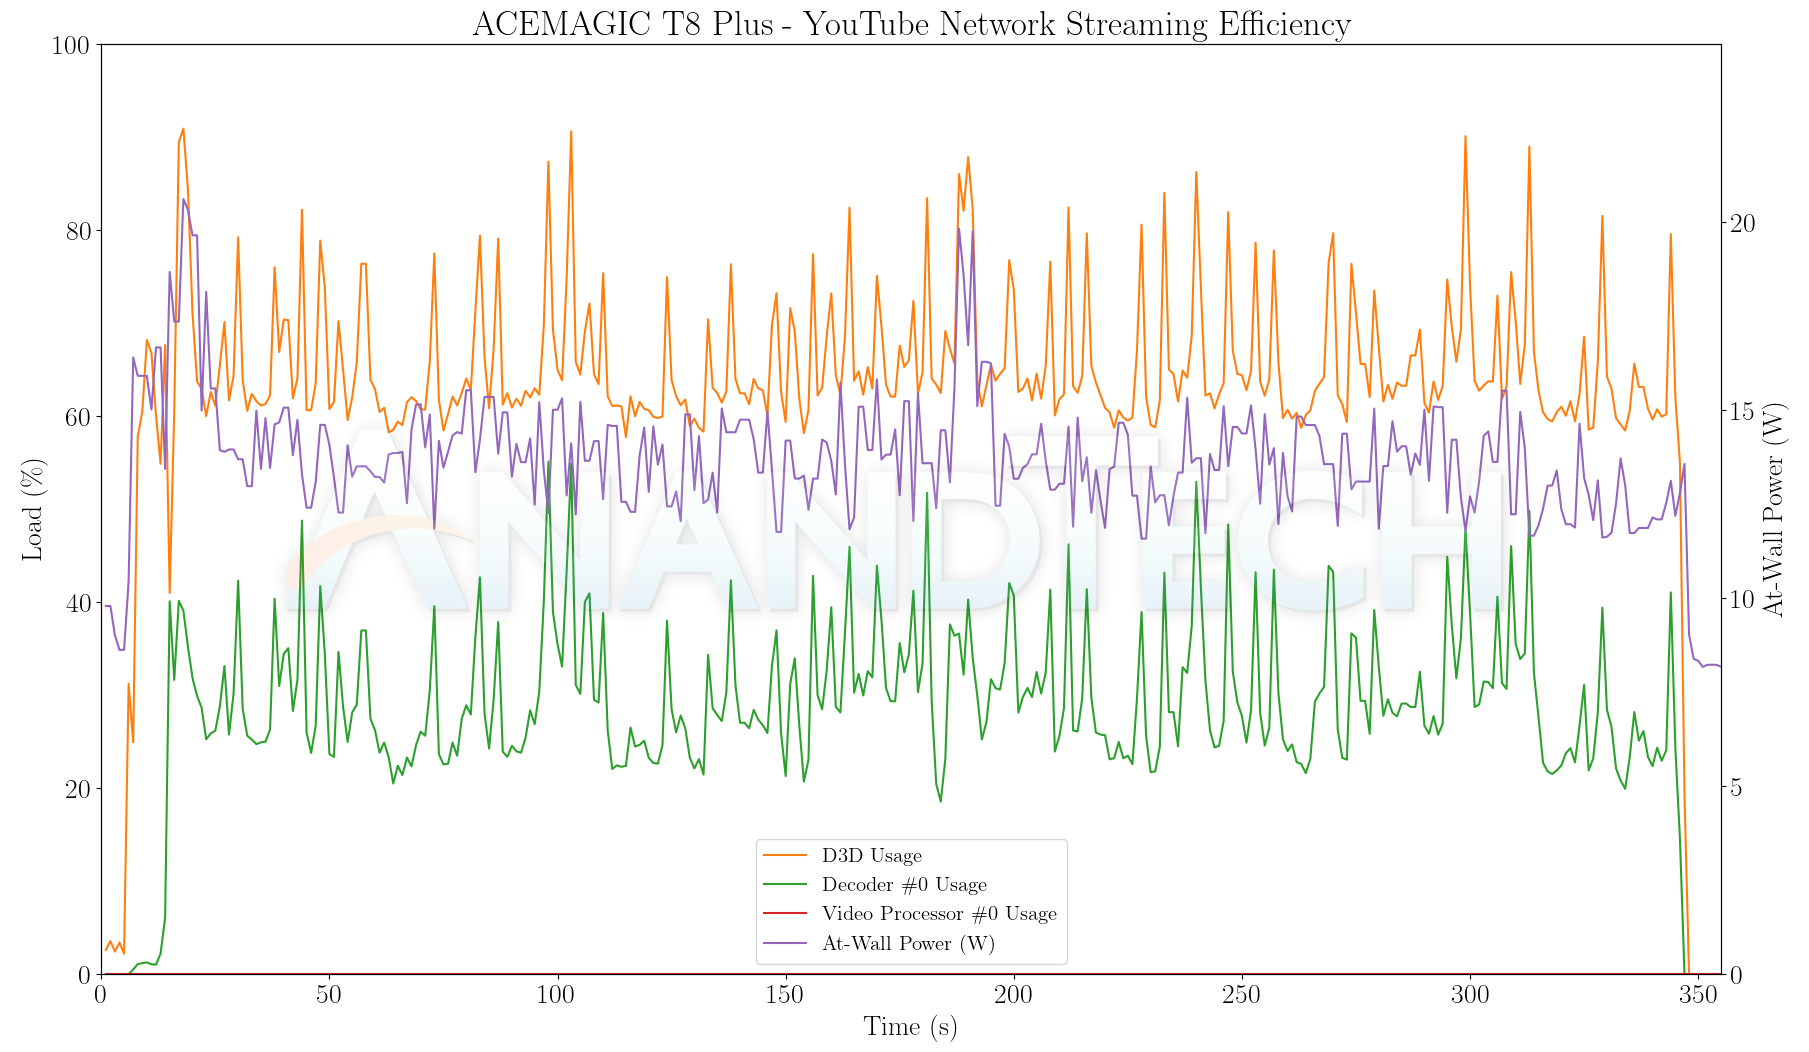
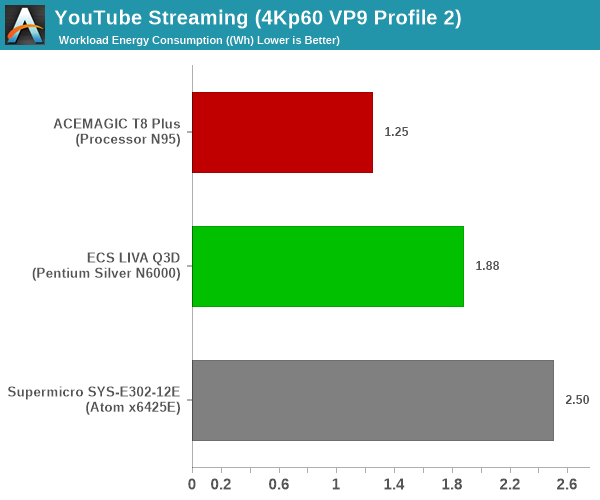
Despite the VP9 Profile 2 in the above graph, it must be noted that the comparison with the T8 Plus here is a case of apples and oranges. The LIVA Q3D is more efficient compared to the Supermicro system, but not by much.
Hardware-Accelerated Encoding and Decoding
The transcoding benchmarks in the systems performance section presented results from evaluating the QuickSync encoder within Handbrake's framework. -- ANY OTHER ENCODER TESTS REFERENCE HERE --. The capabilities of the decoder engine are brought out by DXVAChecker.
| DXVA Checker | |||
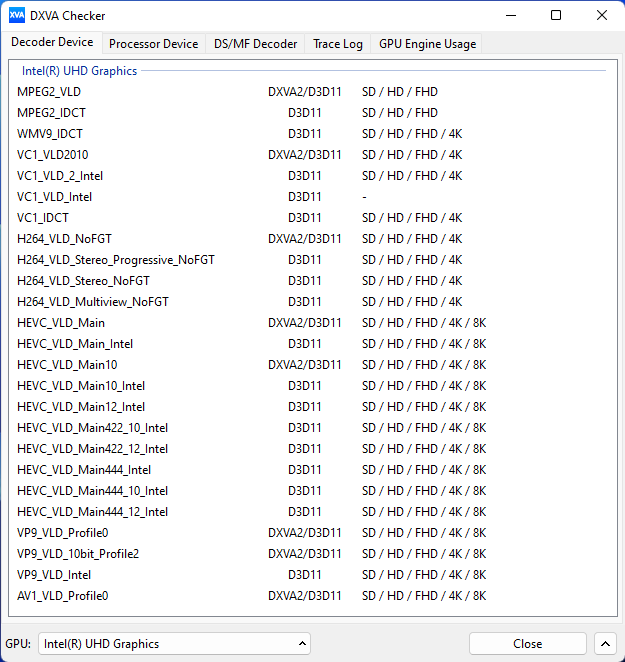
There are significant differences in the codec support. The ECS LIVA Q3D includes VP8 hardware decoding that seems to have been discarded in ADL-N. However, ADL-N includes HEVC 4:2:2 and 4:4:4 12-bit decode support. It also supports AV1. These codecs are not available in Jasper Lake.
Local Media Playback
Evaluation of local media playback and video processing is done by playing back files encompassing a range of relevant codecs, containers, resolutions, and frame rates. A note of the efficiency is also made by tracking GPU usage and power consumption of the system at the wall. Users have their own preference for the playback software / decoder / renderer, and our aim is to have numbers representative of commonly encountered scenarios. Our Q4 2022 test suite update replaces MPC-HC (in LAV filters / madVR modes) with mpv. In addition to being cross-platform and open-source, the player allows easy control via the command-line to enable different shader-based post-processing algorithms. From a benchmarking perspective, the more attractive aspect is the real-time reporting of dropped frames in an easily parseable manner. The players / configurations considered in this subsection include:
- VLC 3.0.18
- Kodi 20.0b1
- mpv 0.35 (hwdec auto, vo=gpu-next)
- mpv 0.35 (hwdec auto, vo=gpu-next, profile=gpu-hq)
Fourteen test streams (each of 90s duration) were played back from the local disk with an interval of 30 seconds in-between. Various metrics including GPU usage, at-wall power consumption, and total energy consumption were recorded during the course of this playback.
All our playback tests were done with the desktop HDR setting turned on. It is possible for certain system configurations to automatically turn on/off the HDR capabilities prior to the playback of a HDR video, but, we didn't take advantage of that in our testing.
| VLC 3.0.18 Video Playback Efficiency | |||
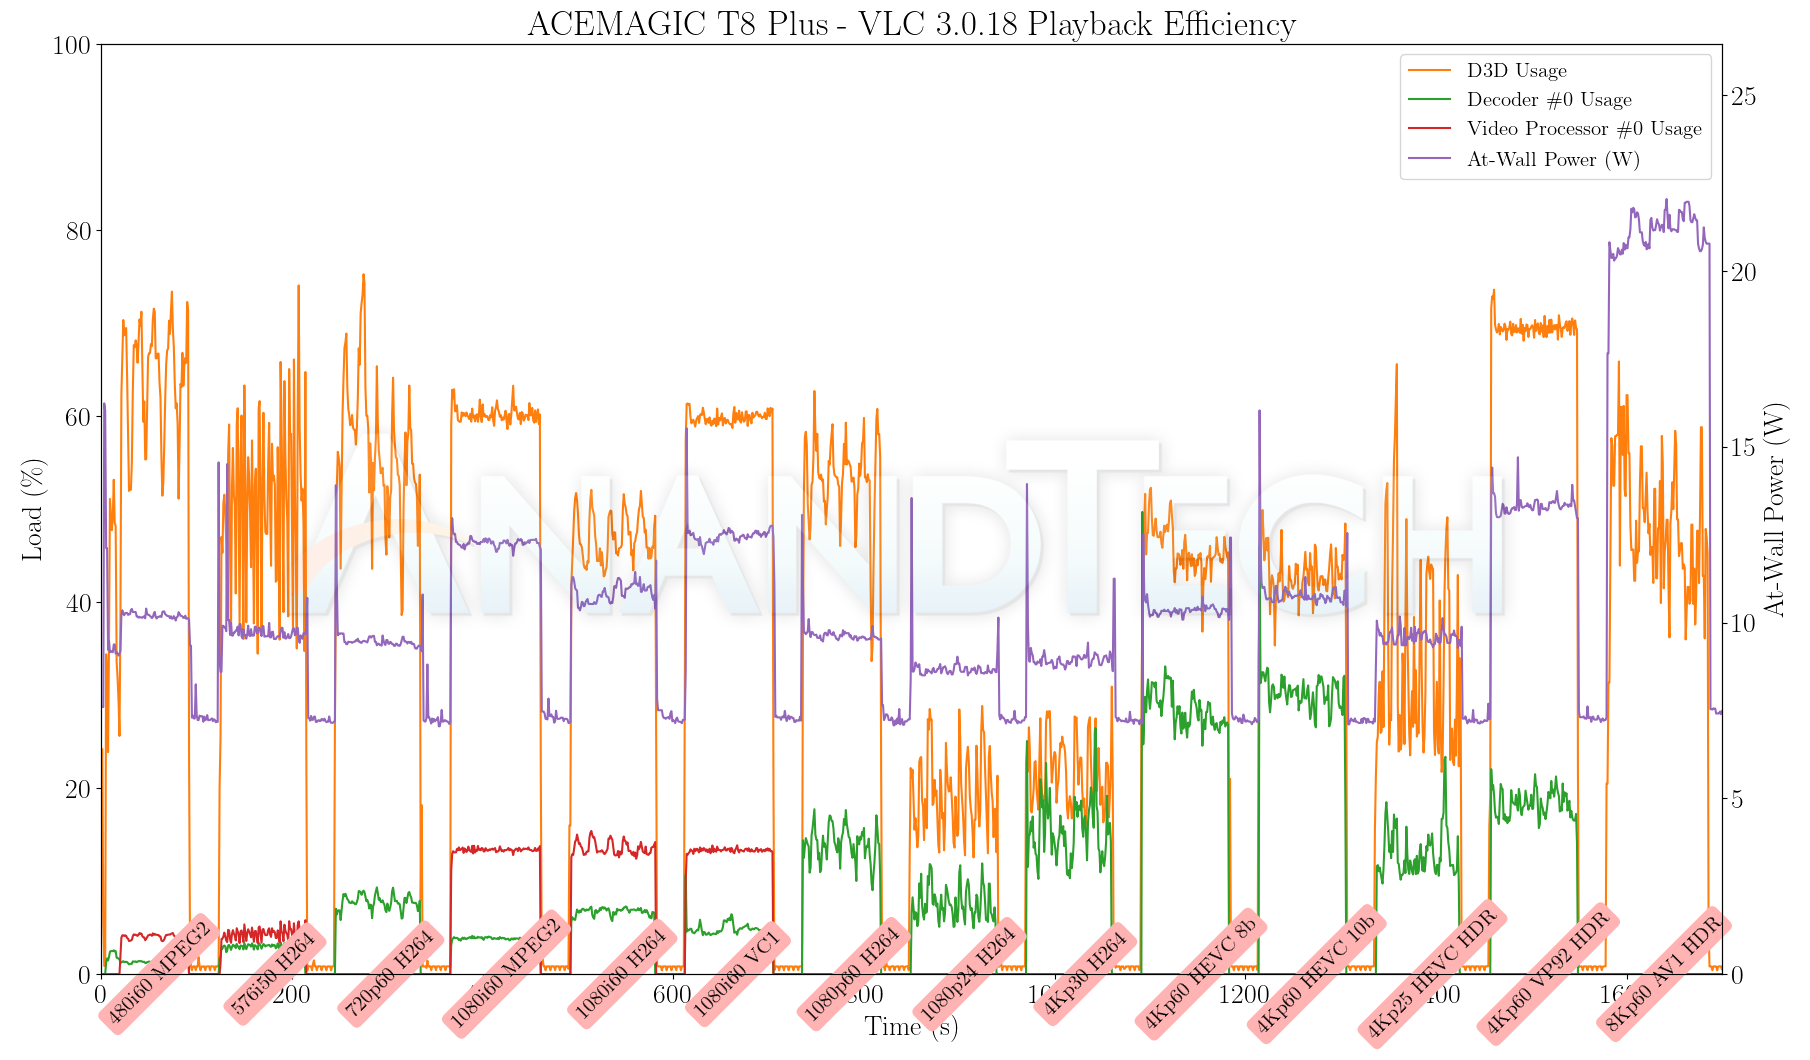
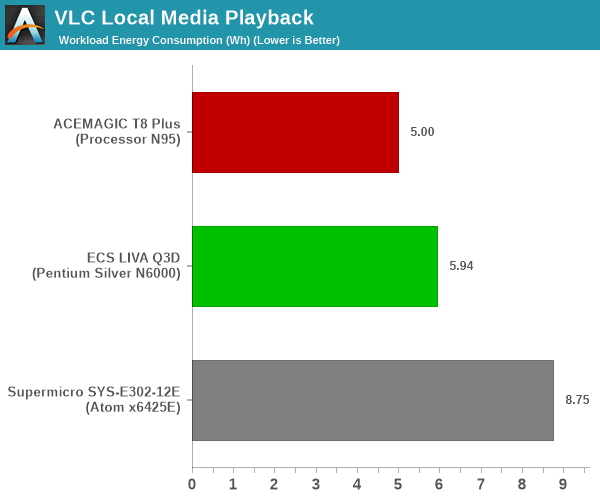
Without HDR in the picture, the T8 Plus consumes the least energy as expected. However, it must also be noted that the decoding of the AV1 clip in software resulted in a slideshow with more than 50% of the frames getting dropped.
| Kodi 20.2 Video Playback Efficiency | |||
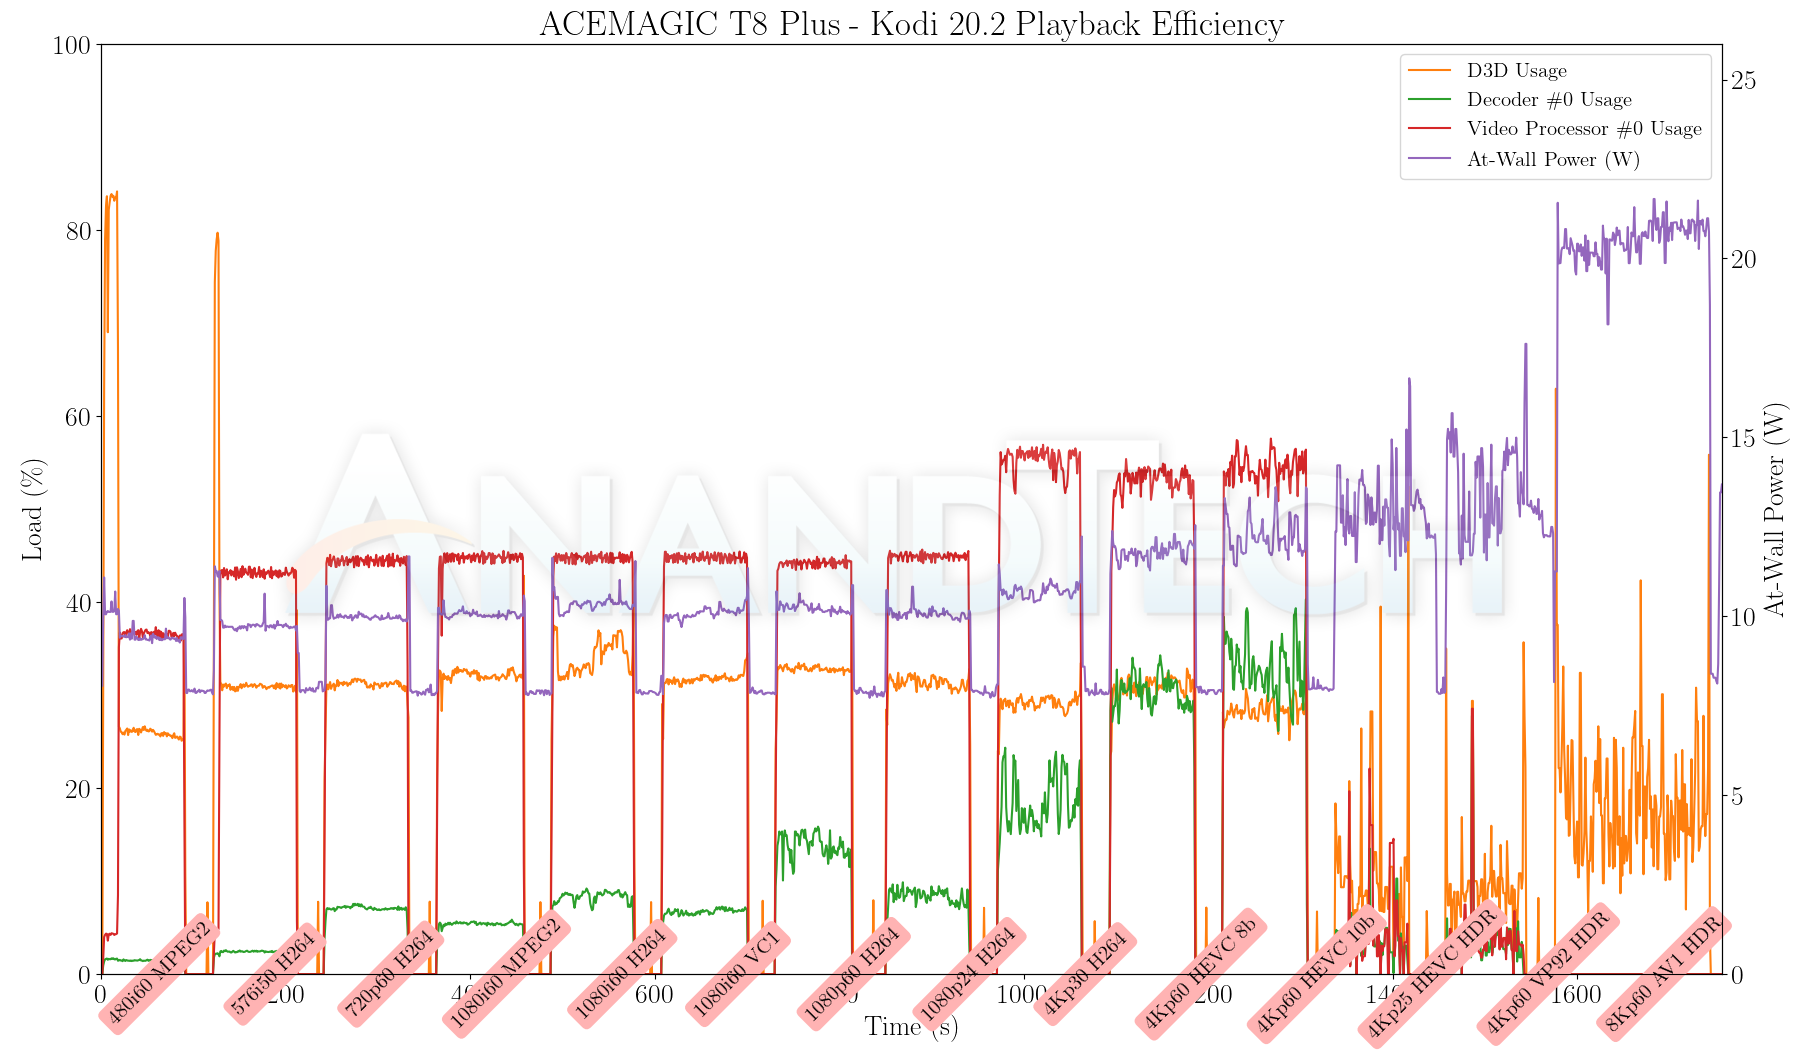
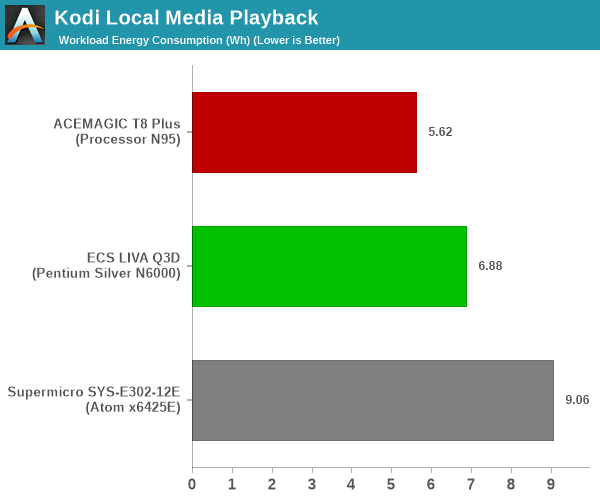
It is evident from the graphs that the playback of the HDR streams on the T8 Plus was a messed up exercise. However, the Q3D didn't have any problems (except for the attempted CPU decoding process for the AV1 clip).
| mpv 0.35.1 Video Playback Efficiency | |||
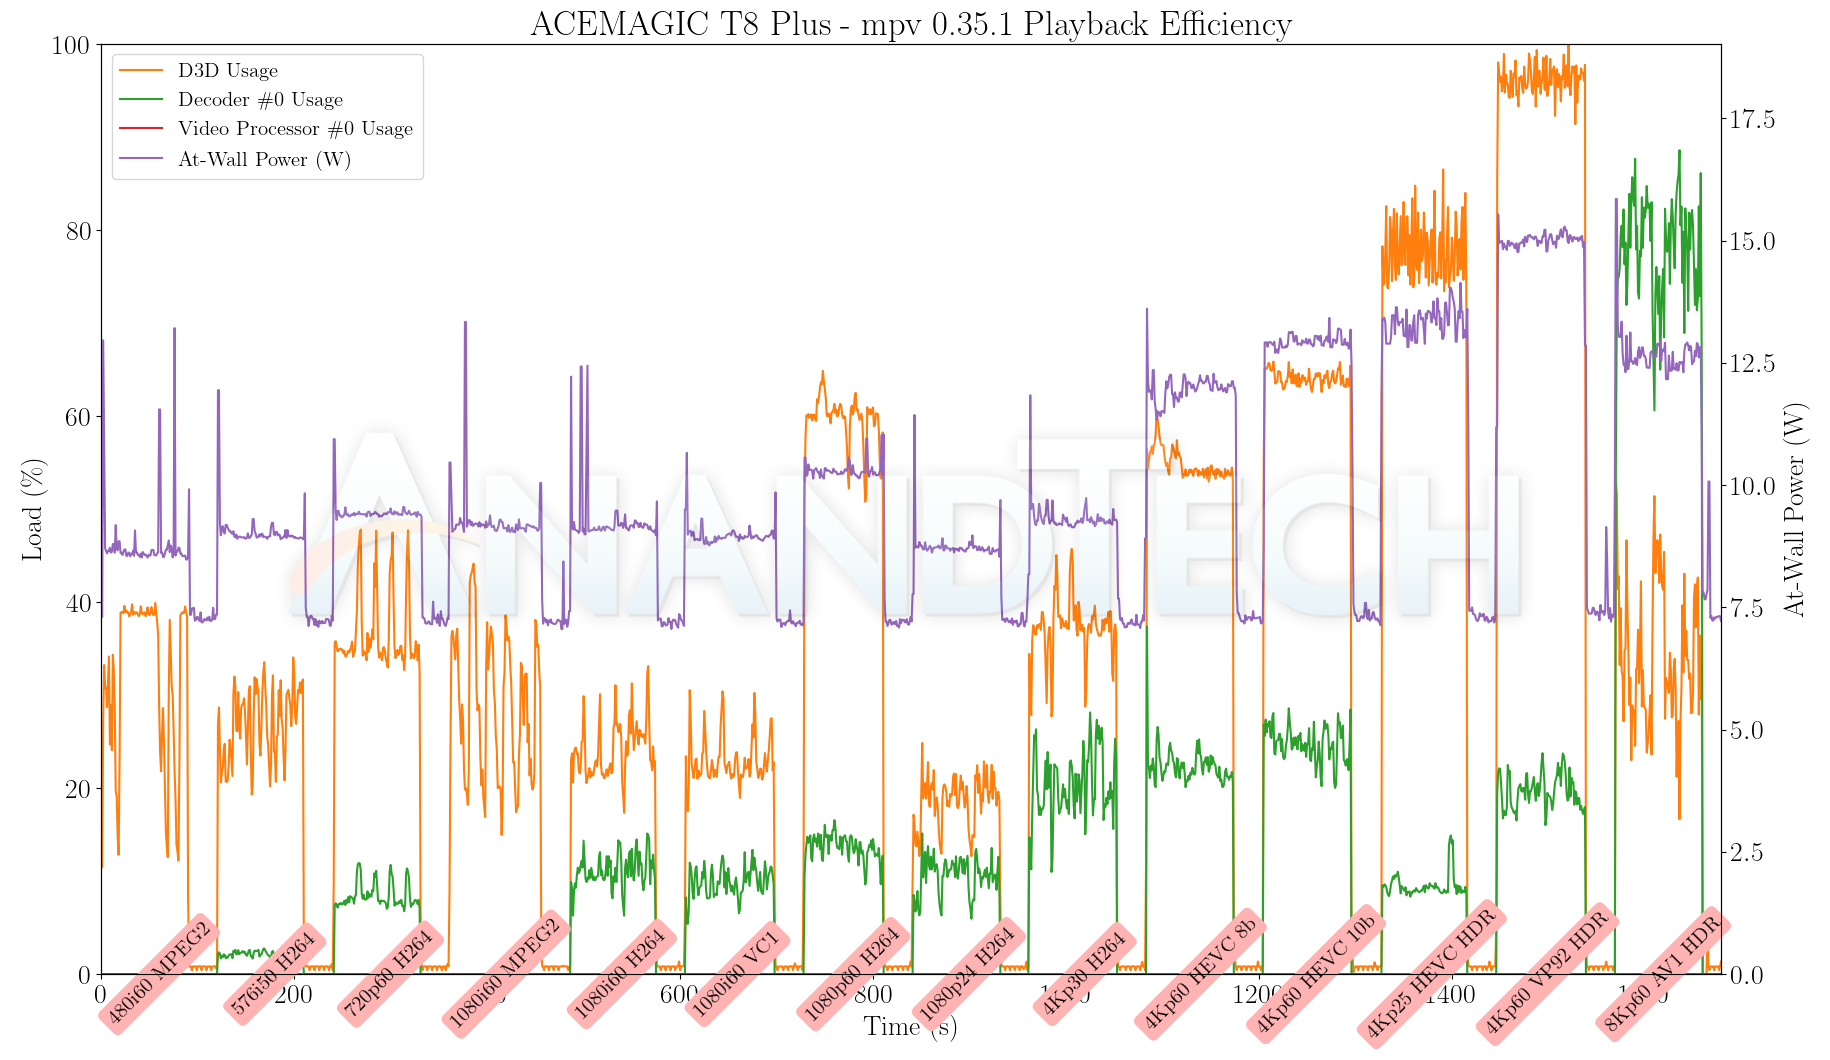
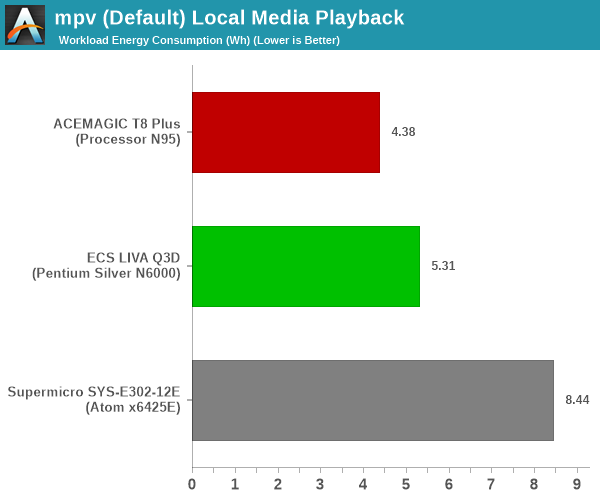
Hardware decoding of AV1 is seen with mpv 0.35.1 on ADL-N. However, approximately half the frames are dropped during rendering (not decoding). However, the exercise as a whole was quite smooth for the other codecs.
| mpv 0.35.1 (GPU-HQ) Video Playback Efficiency | |||
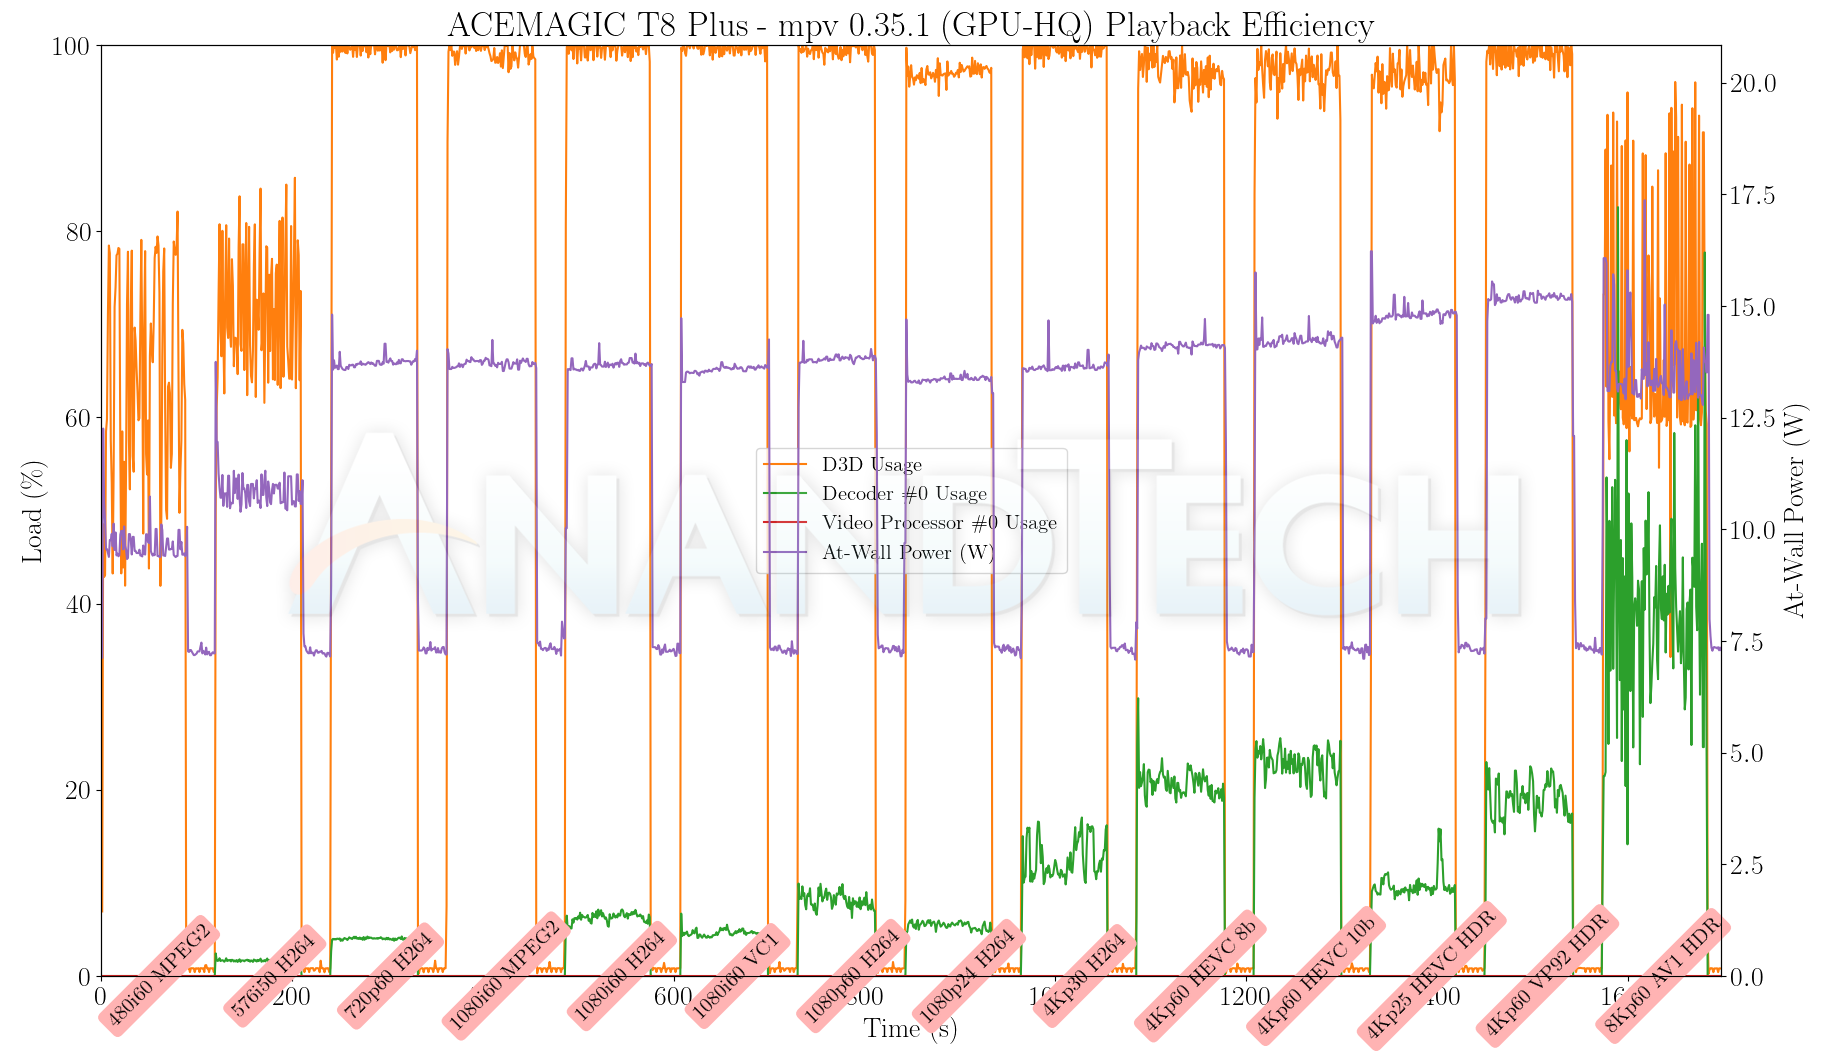
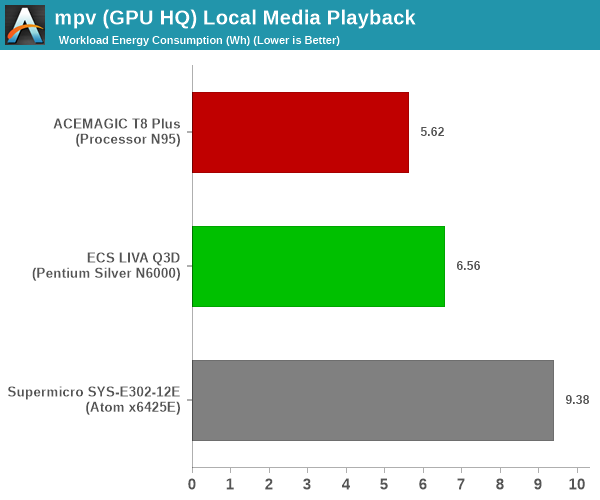
With shader activity in the picture, the playback of most streams with the GPU-HQ profile in mpv 0.35.1 ended up being unwatchable due to the unreasonable D3D usage graphed above.
Power Consumption and Thermal Characteristics
The power consumption at the wall was measured with a 4K display being driven through the HDMI port of the system. In the graph below, we compare the idle and load power of the ACEMAGIC T8 Plus and the ECS LIVA Q3D with other systems evaluated before. For load power consumption, we ran the AIDA64 System Stability Test with various stress components, as well as our custom stress test with Prime95 / Furmark, and noted the peak as well as idling power consumption at the wall.
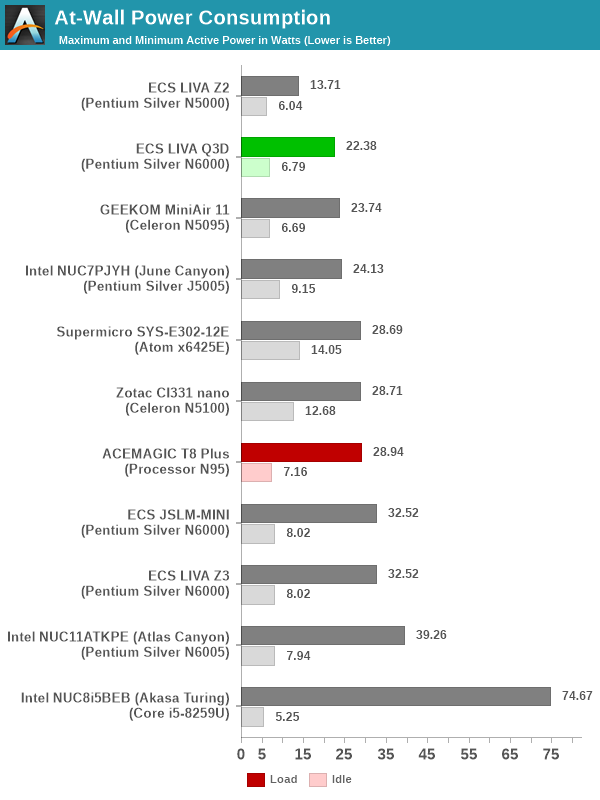
The numbers are consistent with the presence of active fans, as well as the TDP and suggested PL1 / PL2 values for the processors in the systems. The idling numbers are quite good, as aspect that requires proper configuration of C-states in the default BIOS settings.
Stress Testing
Our thermal stress routine is a combination of Prime95, Furmark, and Finalwire's AIDA64 System Stability Test. The following 9-step sequence is followed, starting with the system at idle:
- Start with the Prime95 stress test configured for maximum power consumption
- After 30 minutes, add Furmark GPU stress workload
- After 30 minutes, terminate the Prime95 workload
- After 30 minutes, terminate the Furmark workload and let the system idle
- After 30 minutes of idling, start the AIDA64 System Stress Test (SST) with CPU, caches, and RAM activated
- After 30 minutes, terminate the previous AIDA64 SST and start a new one with the GPU, CPU, caches, and RAM activated
- After 30 minutes, terminate the previous AIDA64 SST and start a new one with only the GPU activated
- After 30 minutes, terminate the previous AIDA64 SST and start a new one with the CPU, GPU, caches, RAM, and SSD activated
- After 30 minutes, terminate the AIDA64 SST and let the system idle for 30 minutes
Traditionally, this test used to record the clock frequencies - however, with the increasing number of cores in modern processors and fine-grained clock control, frequency information makes the graphs cluttered and doesn't contribute much to understanding the thermal performance of the system. The focus is now on the power consumption and temperature profiles to determine if throttling is in play.
| Custom Stress Test - Power Consumption Profile | |||
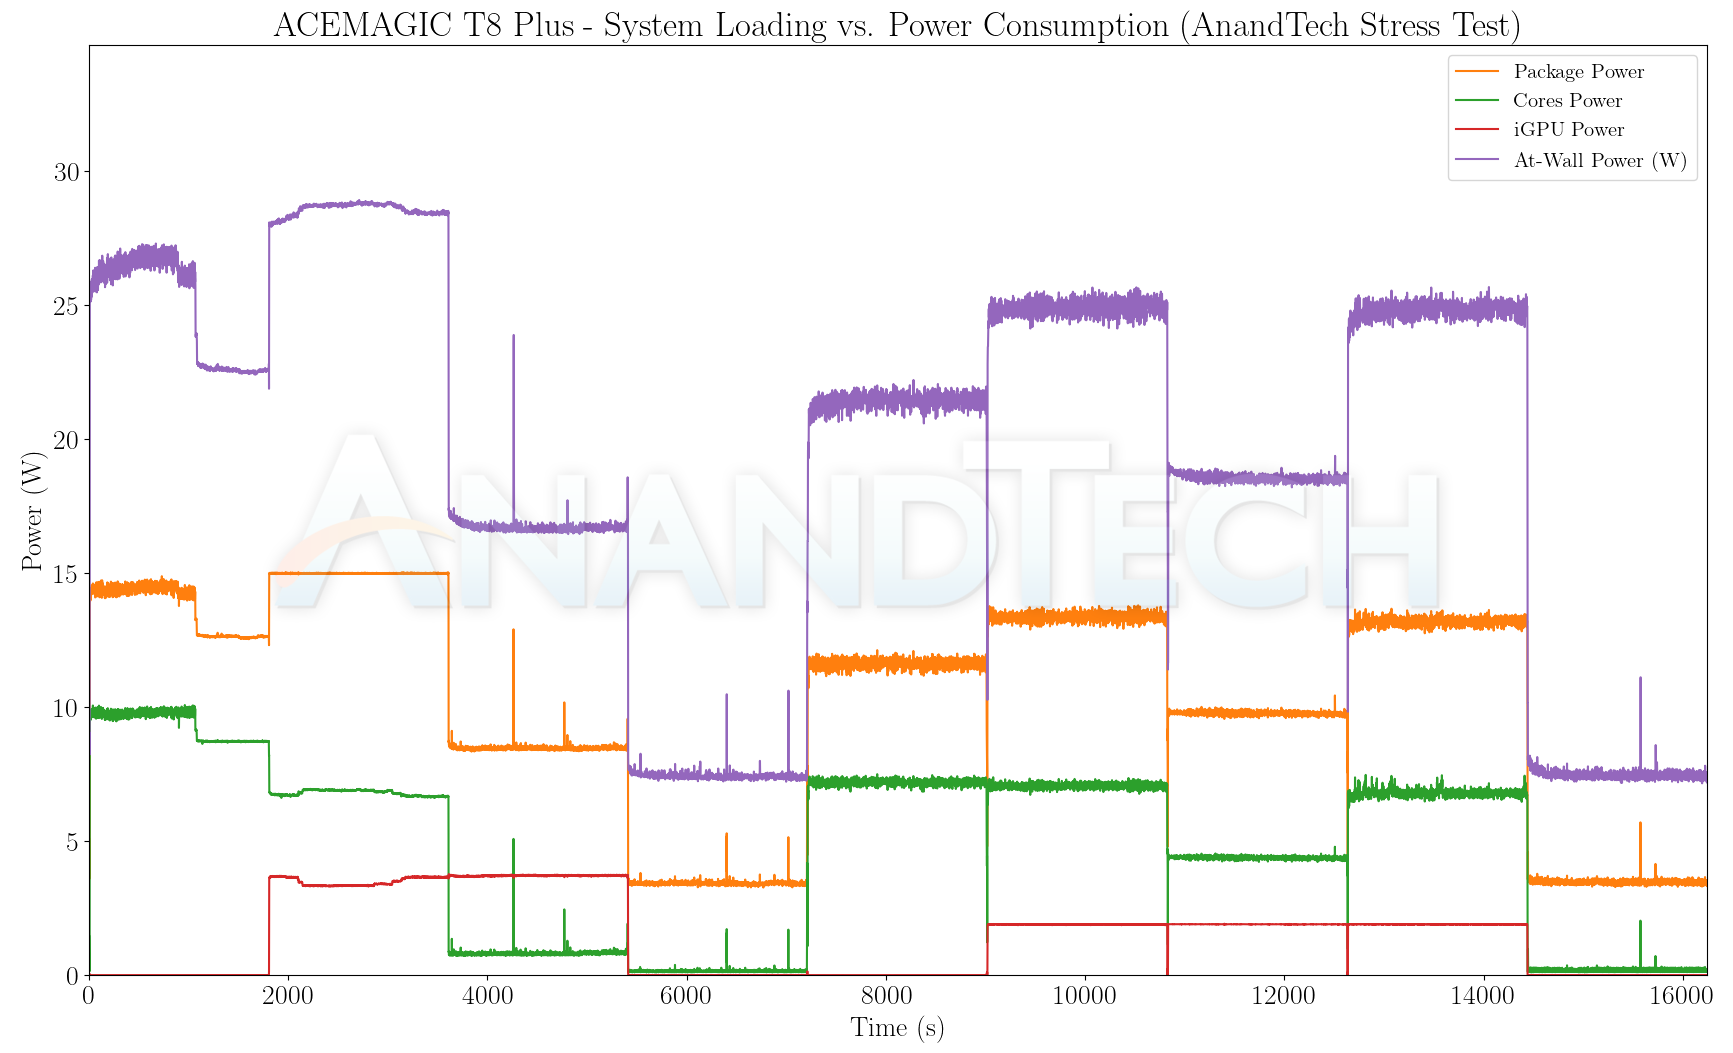
In the T8 Plus, Prime 95 sees the Intel Processor N95 start off around 15W for the package, but that drops down to around 12W midway. Usually, this happens due to thermal throttling, but a look at the temperatures in the graph below sees the package / core temperatures just north of 80C. It appears that ACEMAGIC has configured the BIOS to throttle prematurely, as the temperatures are otherwise kept south of 80C throughout the stress test. Putting Prime95 and Furmark together sees the package maintaining a smooth 15W throughout the segment. Loading up the GPU alone keeps the package power around 10W.
The LIVA Q3D has a PL2 of 25W, but the spike is imperceptible in the 1 second polling interval used in the graph above. ECS has no qualms about maintaining the temperatures around 90C to sustain 10W for the Jasper Lake processor.
| Custom Stress Test - Temperature Profile | |||
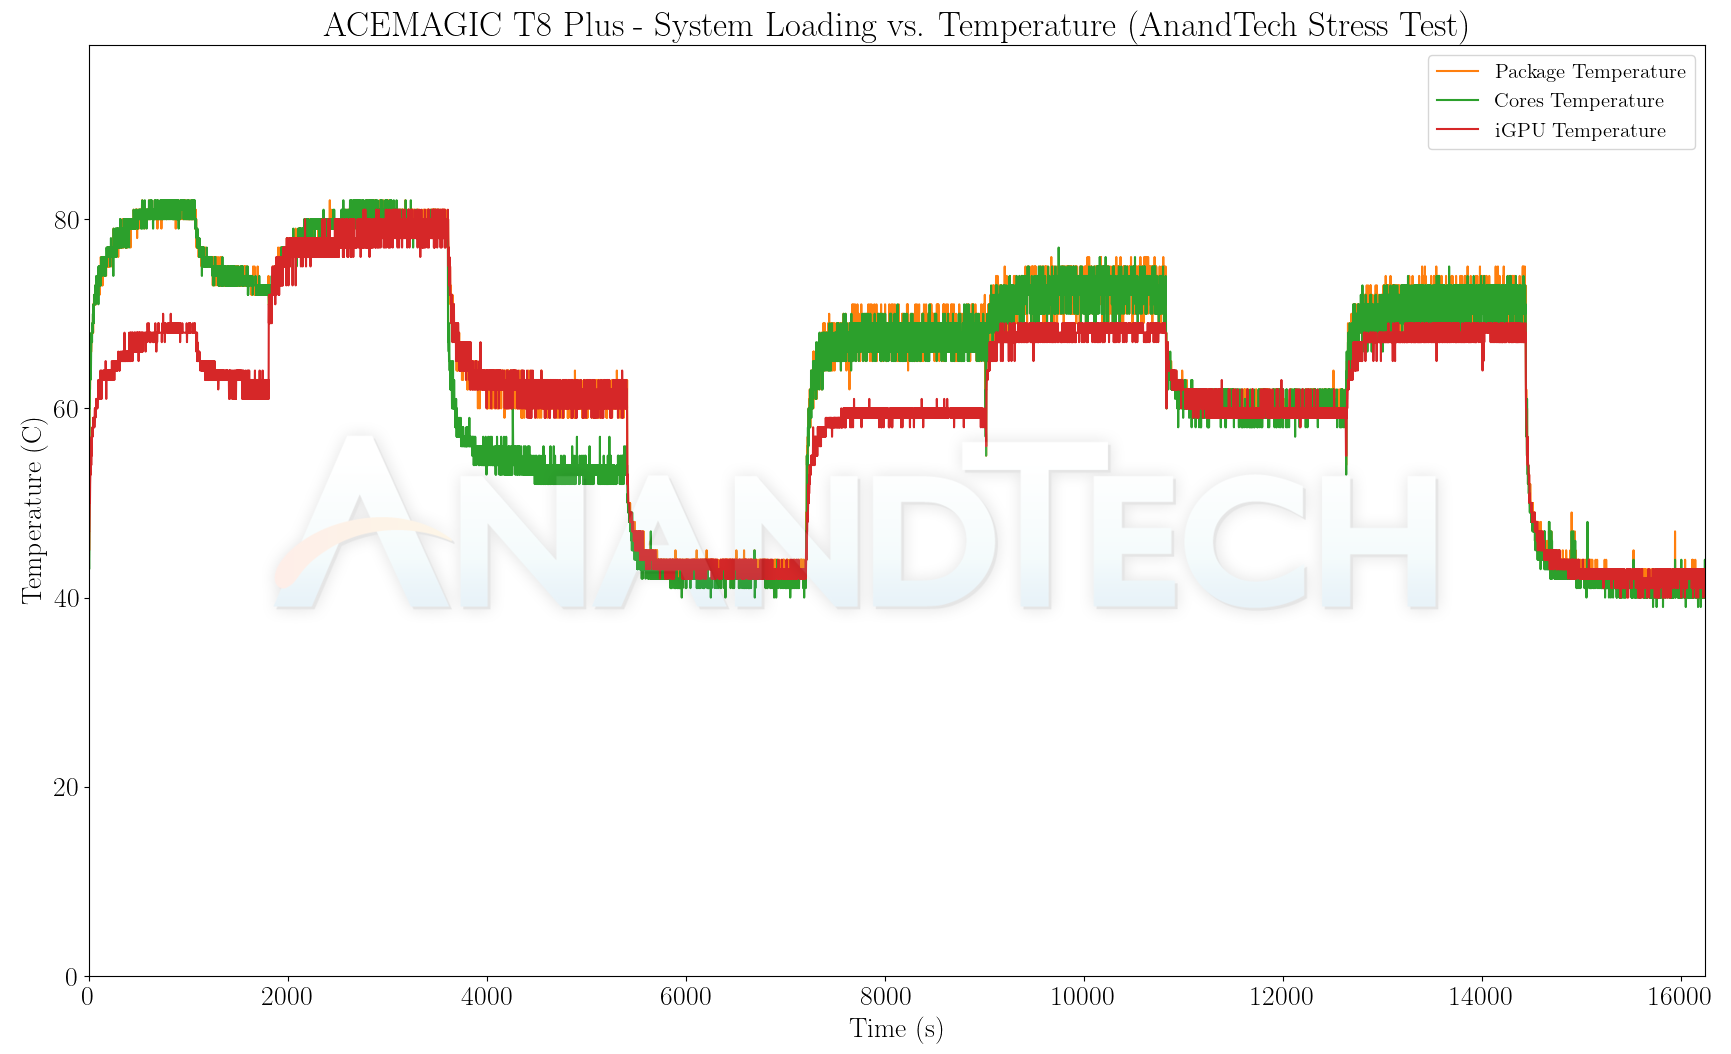
It is interesting to note that the thermal solution of the T8 Plus seems more effective than the LIVA Q3D. At the same time, we have to keep in mind that the LIVA is much more compact. The raised chassis design of the T8 Plus also possibly contributes to better airflow. Overall, it would have been nice to see lower temperatures on the LIVA Q3D, but ECS is able to guarantee the ability to dissipate the rated 10W package power for the Pentium Silver N6000.
Miscellaneous Aspects and Concluding Remarks
Networking and storage are aspects that may be of vital importance in specific PC use-cases. The ACEMAGIC T8 Plus comes with dual LAN ports backed by Realtek Gigabit Ethernet network controllers, while the ECS LIVA Q3D has only one wired LAN port. The Wi-Fi support in both systems is a bit dated - Wi-Fi 5. While the ECS system employs a 2x2 solution, the T8 Plus wireless networking support seems to have been an afterthought with a 1x1 solution.
On the storage side, the ECS LIVA Q3D employs an eMMC solution. Unlike the LIVA Z3 that had a M.2 NVMe SSD slot, this system only offers a microSDXC expansion slot. We opted to evaluate the system with the supplied 128 GB eMMC drive. The capacity is too low to run our usual SPECworkstation 3.1 WPCstorage suite, but that was not a problem for the 512GB M.2 SATA SSD in the ACEMAGIC T8 Plus.
From a benchmarking perspective, we provide results from the WPCstorage test of SPECworkstation 3.1. This benchmark replays access traces from various programs used in different verticals and compares the score against the one obtained with a 2017 SanDisk 512GB SATA SSD in the SPECworkstation 3.1 reference system.
| SPECworkstation 3.1.0 - WPCstorage SPEC Ratio Scores | |||
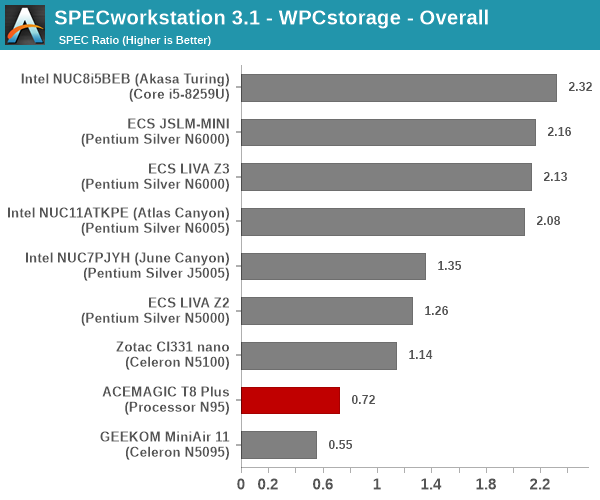
The graphs above present results for different verticals, as grouped by SPECworkstation 3.1. The storage workload consists of 60 subtests. Access traces from CFD solvers and programs such as Catia, Creo, and Soidworks come under 'Product Development'. Storage access traces from the NAMD and LAMMPS molecular dynamics simulator are under the 'Life Sciences' category. 'General Operations' includes access traces from 7-Zip and Mozilla programs. The 'Energy' category replays traces from the energy-02 SPECviewperf workload. The 'Media and Entertainment' vertical includes Handbrake, Maya, and 3dsmax. Given that the comparison is between a wide range of SSDs in the systems - including both Gen 3 NVMe and SATA, the relative numbers for most workloads are not surprising. The FuturePath SATA SSD used in the T8 Plus puts the system consistently in the bottom half of the above graphs.
In order to put the performance of the T8 Plus's storage solution in perspective, we also got the Kingston eMMC drive into the picture with the help of our usual CrystalDiskMark multi-corner workload. With a 32GB span, this workload also exposes possible use of QLC.
| CrystalDiskMark Workloads | |||
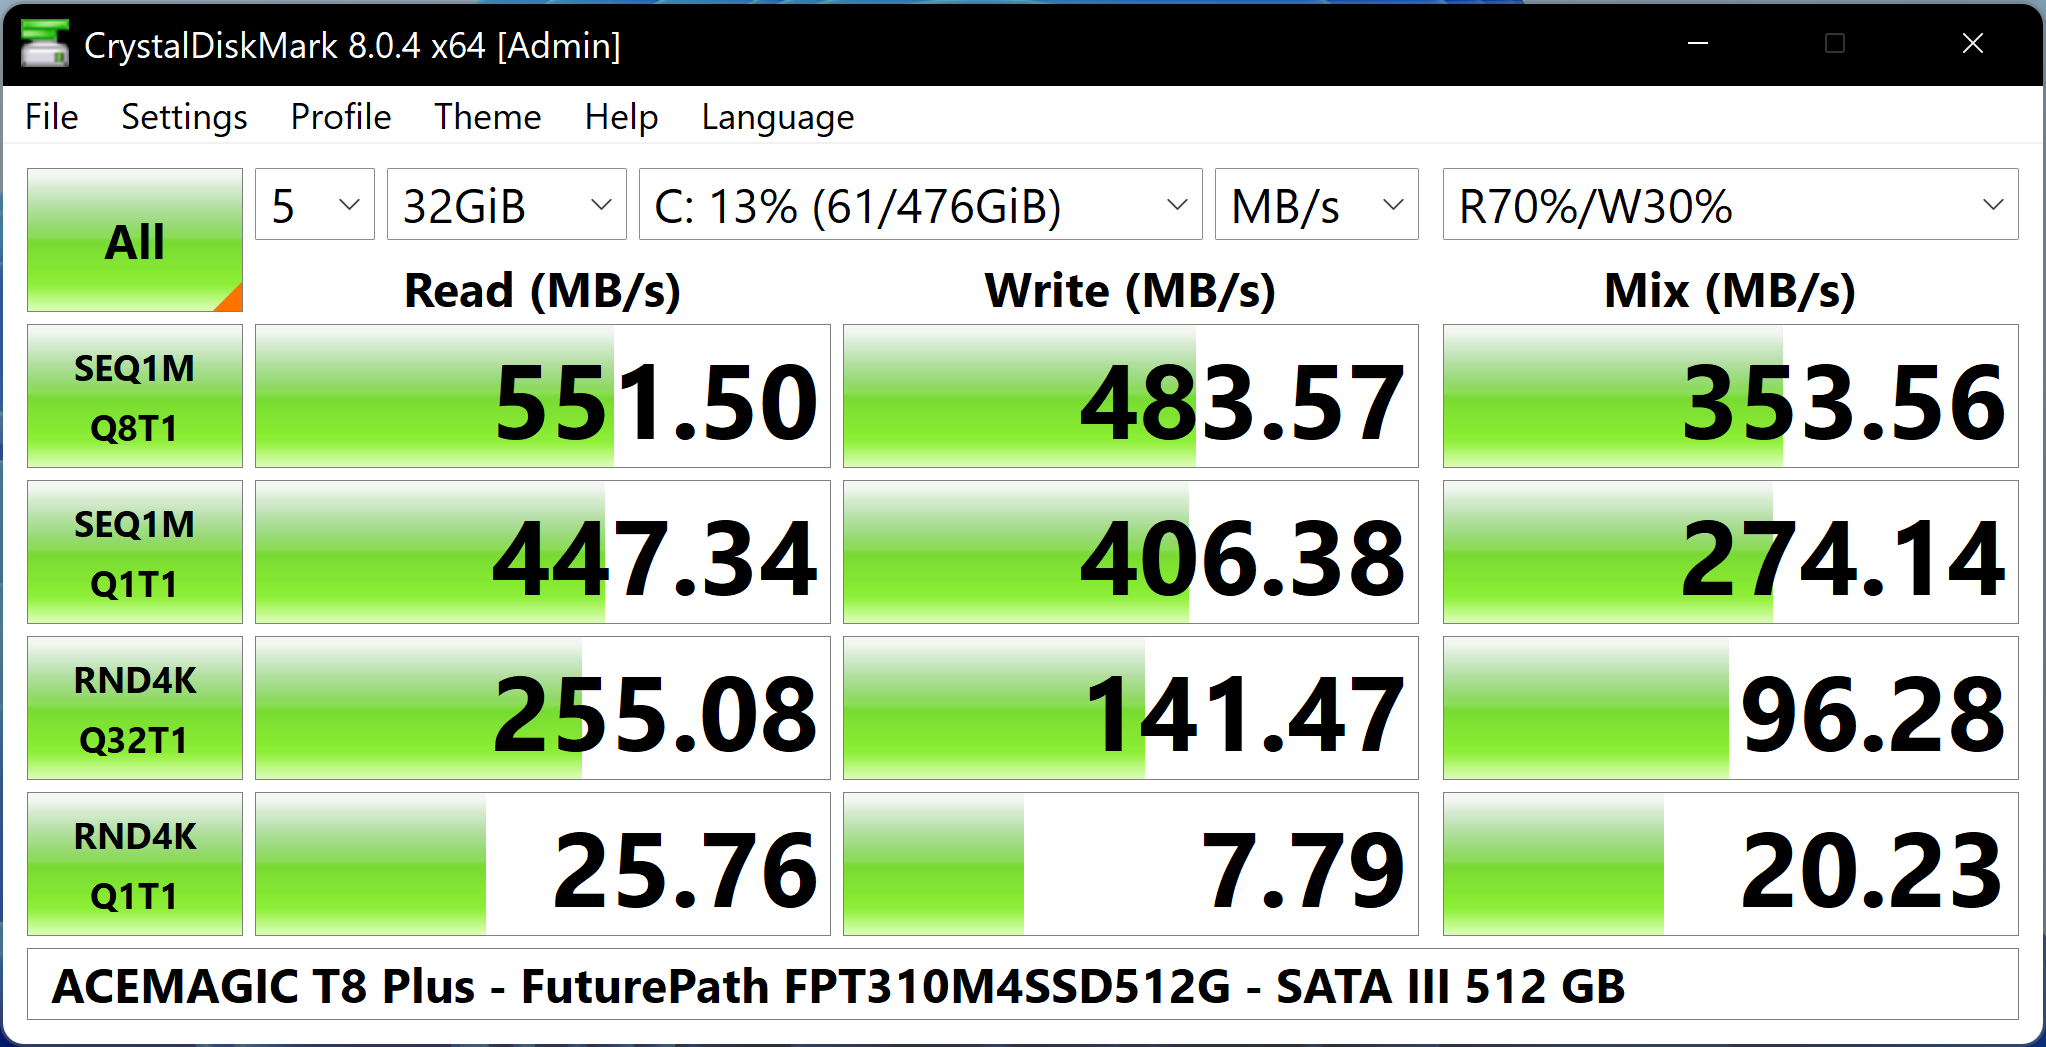
Based on the results above, it appears that the FuturePath SSD utilizes TLC NAND. Also, the performance is quite good for a SATA SSD. On the other hand, we see the absence of NCQ support in the eMMC drive. That has a negative impact on the responsiveness and user experience for generic usage. Obviously, there are multiple use-cases (such as digital kiosks or point-of-sale terminals) where the storage drive performance profile may not be that much of a concern.
Closing Thoughts
ECS had pitched their Q series for review multiple times in the past, but I had been wary of taking those up. I had my concerns about the effectiveness of the thermal solution in such a small package and tradeoffs related to the I/O capabilities. A few months back, I noticed multiple micro-PC models from Asian vendors such as AceMagician and GMKtec. With my interest piqued, I took up ECS's pitch for the LIVA Q3D when it came across earlier this year.
Having completed its evaluation early on, we were waiting for it to become available in the market before posting the review. Unfortunately, there is still no sign of the system on either Amazon or Newegg. With Jasper Lake about to go out of style, we managed to quickly source an Alder Lake-N system in a similar form factor from AceMagician. The ACEMAGIC T8 Plus and the ECS LIVA Q3D are both micro-PCs (sub-4x4), but the slightly larger footprint of the T8 Plus allows it to be equipped with additional functionality.

The T8 Plus has three native display outputs compared to the two in the LIVA Q3D. The system also has more number of external high-speed interfaces. In particular, the presence of dual LAN ports opens up a variety of use-cases. The Intel Processor N95 in the T8 Plus is configured for a 15W TDP, and that is enough for it to outperform the 10W Pentium Silver N6000 in the LIVA Q3D across pretty much all CPU and GPU workloads in our evaluation suite. Our only complaints against the T8 Plus are related to the HDR capabilities of some of its HDMI ports, and its unnecessarily proactive thermal throttling. Using USB-C PD for power input (and also using that USB-C port for data purposes) is something we would have liked to see in both systems. Another option would be to incorporate support for PoE operation - hopefully these are aspects that manufacturers can address in the next-generation systems.
Due to the difference in the power budget (15W for the ADL-N Processor N95 and 10W for the Jasper Lake Pentium Silver N6000), we were unable to judge the effectiveness of the improvements made in Gracemont over Tremont from a performance perspective. The additional execution units of the Jasper Lake GPU in the LIVA Q3D over the one in the ADL-N GPU in the T8 Plus also complicated the comparison of the graphical prowess of the two product families. We may have to evaluate other processors in the Alder Lake-N family to get a better idea of the generational improvements.
The micro-PC form factor has its advantages in terms of portability. It can also be deployed in space constrained scenarios where the traditional 4x4 systems are too bulky. However, for this to be a key advantage, such systems must either allow for PoE operation or have DC Euroblock connectors. As they stand now, the LIVA Q3D and T8 Plus are both novelty systems, and most users would be better off with a 4x4 system having more I/O interfaces.
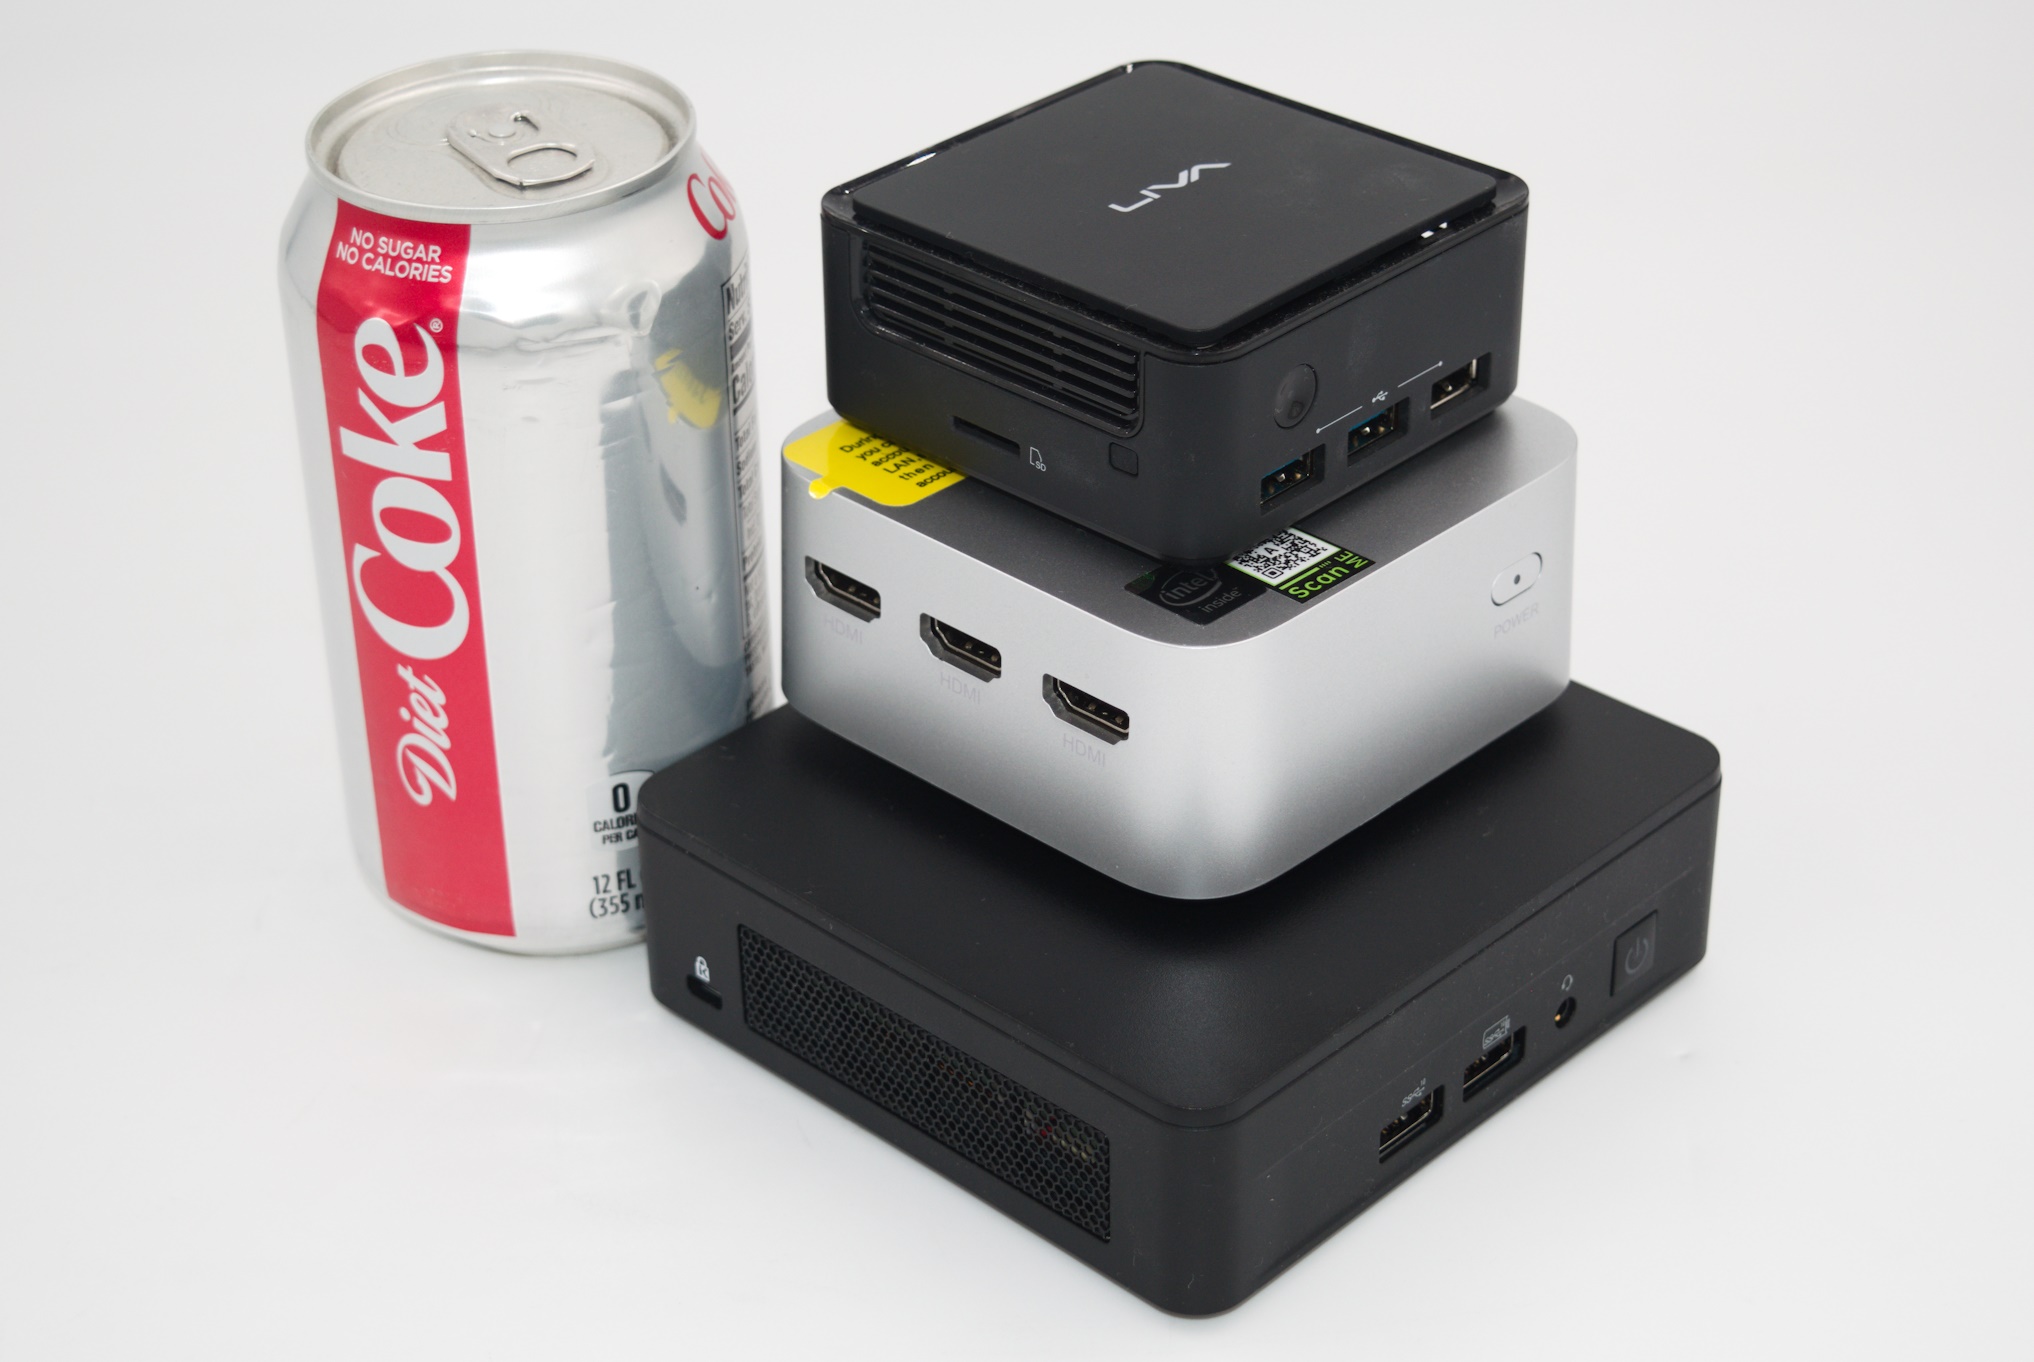
Micro-PCs size comparison against a 4x4 mainstream Intel NUC
ECS indicated that they would be selling the LIVA Q3D N6000 / 4GB RAM / 128GB eMMC model for $285. We believe that the street price should be much lower than that, particularly when systems like the ACEMAGIC T8 Plus are taken into consideration. Our review configuration of the T8 Plus with the Intel Processor N95, 16 GB of LPDDR5-3200 RAM, and a 512 GB M.2 SATA drive is priced at $207. Amazon currently has discount coupons available at checkout, and AceMagician has also provided AnandTech readers with a limited use / limited time coupon UQSYLW9R to bring down the price to $177. At that price, the value proposition of the system is excellent.


